 |
PeakTrader.com
Economics, Portfolio Optimization, and Technical Analysis
|
| View previous topic :: View next topic |
| Author |
Message |
arthur
Guest
|
 Posted: Sat Sep 17, 2005 10:51 am Post subject: WMT Charts Posted: Sat Sep 17, 2005 10:51 am Post subject: WMT Charts |
 |
|
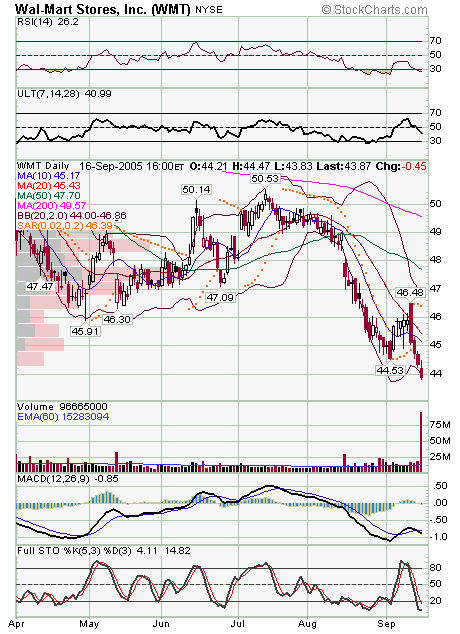
The first chart is a WMT daily chart that shows volume Friday was 96.7 million shares, about eight times greater than the three-month average of 12.6 million shares, which may indicate support around 44.
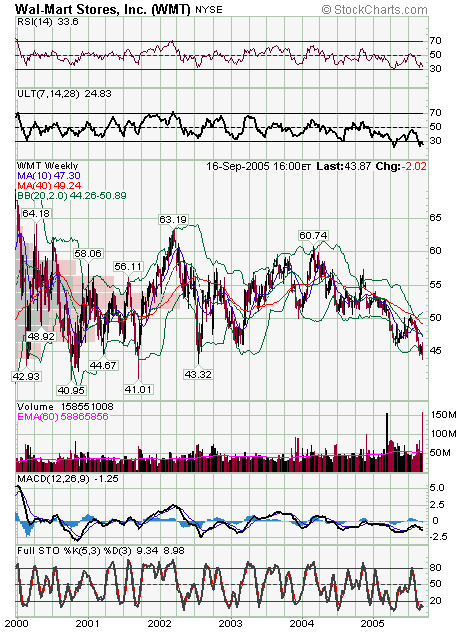
The second chart is a WMT weekly chart that shows a trading range over the past 5 1/2 years. The weekly ULT (oscillator) is below 25. The last time ULT was that low, WMT bounced three points within a few weeks.
WMT fell sharply recently on slowing employment growth, because of hurricane Katrina, and high gasoline and crude oil prices, which displace consumption, and increase transportation costs.
WMT Jan 42.5 calls closed at 3.10 Friday, and those calls may be buys on pullbacks. WMT may bounce 1 1/2 points short-term, which may be an opportunity to sell some calls. Longer-term, within the next two or three months, WMT may be three points higher at 47.
 |
|
| Back to top |
|
 |
|
|
You cannot post new topics in this forum
You cannot reply to topics in this forum
You cannot edit your posts in this forum
You cannot delete your posts in this forum
You cannot vote in polls in this forum
|
|
 FAQ
FAQ Search
 Memberlist
 Usergroups
 Register
 Profile
 Log in to check your private messages
 Log in
