 |
PeakTrader.com
Economics, Portfolio Optimization, and Technical Analysis
|
| View previous topic :: View next topic |
| Author |
Message |
arthur
Guest
|
 Posted: Sat Jan 22, 2005 11:28 am Post subject: SMH Chart Posted: Sat Jan 22, 2005 11:28 am Post subject: SMH Chart |
 |
|
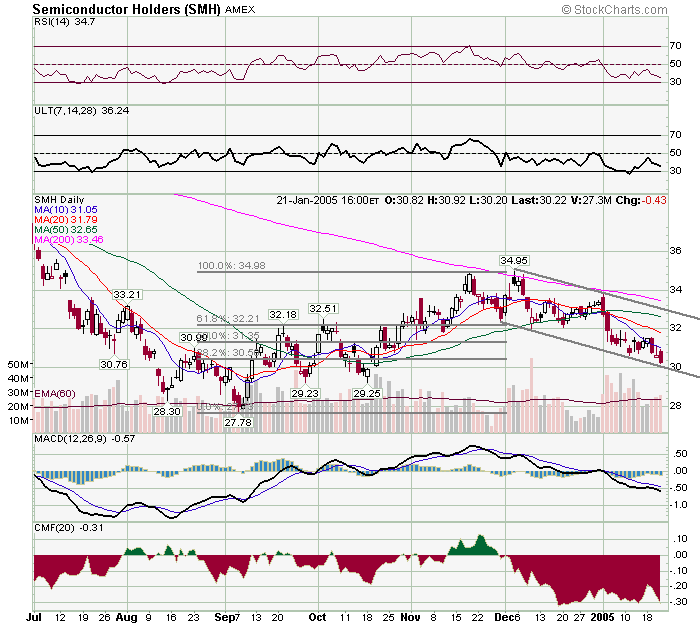
SMH has already retraced over 50% of the rally from the Sep (and 2004) low at 27.78 to the Dec high at 34.95, closing at 30.22 Fri. The parallel downward channel fits very well with recent tops and bottoms. Currently, SMH is near the bottom of the channel. Consequently, there may be little short-term downside risk. Major resistance is at 31.79 (current 20 day MA) and then 32.65 (current 50 day MA). Several semiconductor stocks are reporting earnings next week. So, perhaps, SMH will bounce.
 |
|
| Back to top |
|
 |
|
|
You cannot post new topics in this forum
You cannot reply to topics in this forum
You cannot edit your posts in this forum
You cannot delete your posts in this forum
You cannot vote in polls in this forum
|
|
 FAQ
FAQ Search
 Memberlist
 Usergroups
 Register
 Profile
 Log in to check your private messages
 Log in
