 |
PeakTrader.com
Economics, Portfolio Optimization, and Technical Analysis
|
| View previous topic :: View next topic |
| Author |
Message |
arthur
Guest
|
 Posted: Wed Jan 05, 2005 7:09 pm Post subject: INTC Chart (low-risk long-term hold) Posted: Wed Jan 05, 2005 7:09 pm Post subject: INTC Chart (low-risk long-term hold) |
 |
|
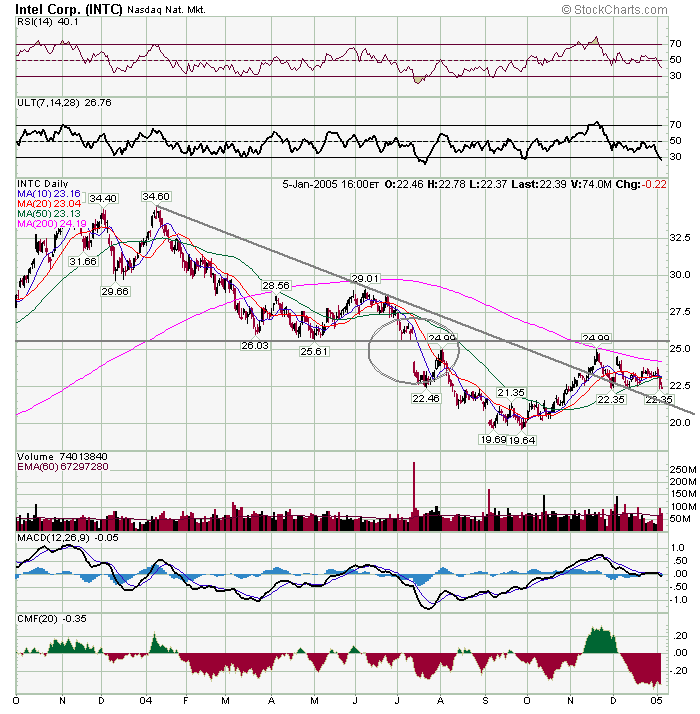
INTC (both a Dow and Nasdaq 100 stock) had a tough year in 2004. The 10 day MA is still above the 20 day MA, which is bullish. The gap at over 25 hasn't been closed (although, it rallied to 24.99 twice after creating the gap). The bullish cup-and-handle pattern is still intact if it can hold 22.35. INTC may be in position to rally big perhaps on earnings Tue. The oversold oscillator (ULT) also suggests a big bounce. There is little risk at it's current price, since just below 22 1/2 was tested four times recently. Consequently, INTC may be bought at its current price with a stop at 22 or the downtrend line at 21 1/4. I believe, INTC will close the gap at over 25 within the next few months.
 |
|
| Back to top |
|
 |
|
|
You cannot post new topics in this forum
You cannot reply to topics in this forum
You cannot edit your posts in this forum
You cannot delete your posts in this forum
You cannot vote in polls in this forum
|
|
 FAQ
FAQ Search
 Memberlist
 Usergroups
 Register
 Profile
 Log in to check your private messages
 Log in
