 |
PeakTrader.com
Economics, Portfolio Optimization, and Technical Analysis
|
| View previous topic :: View next topic |
| Author |
Message |
arthur
Guest
|
 Posted: Thu Dec 30, 2004 5:29 pm Post subject: OEX Chart Posted: Thu Dec 30, 2004 5:29 pm Post subject: OEX Chart |
 |
|
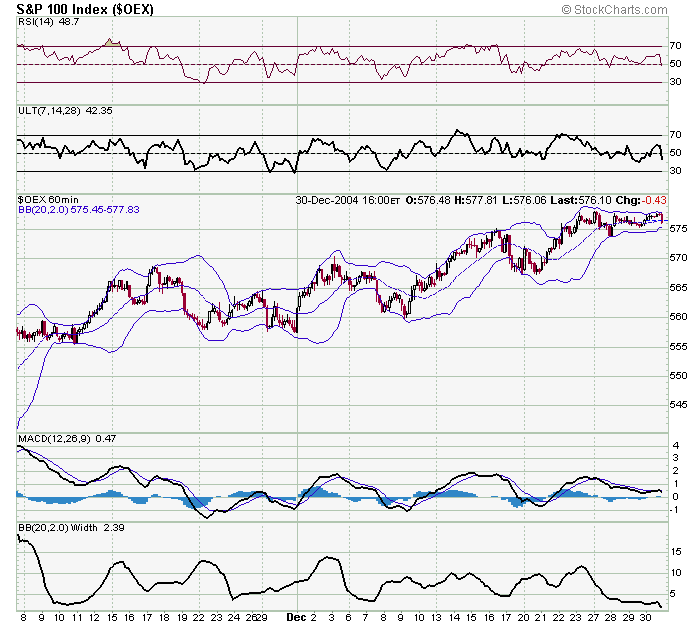
The OEX (S&P 100) hourly chart over the past six or seven weeks show a slow and steady climb. Currently, the Bollinger Bands are narrowing, which typically indicate a big move (to upside or downside) soon. Mon is the first trading day of the new year. So, perhaps, the move will be to the upside. Some of the OEX Jan calls (roughly) closed as follows:
Jan 570 10.00
Jan 575 7.00
Jan 580 4.30
Jan 585 2.50
Perhaps, OEX will bounce at least five points early next week (if SPX rises 10 points, then OEX typically rises five points). So, if OEX pulls-back a little tomorrow, the Jan 575 calls, for example, may be bought below 7 and sold early next week at over 10.
 |
|
| Back to top |
|
 |
|
|
You cannot post new topics in this forum
You cannot reply to topics in this forum
You cannot edit your posts in this forum
You cannot delete your posts in this forum
You cannot vote in polls in this forum
|
|
 FAQ
FAQ Search
 Memberlist
 Usergroups
 Register
 Profile
 Log in to check your private messages
 Log in
