 |
PeakTrader.com
Economics, Portfolio Optimization, and Technical Analysis
|
| View previous topic :: View next topic |
| Author |
Message |
arthur
Guest
|
 Posted: Fri Dec 17, 2004 8:59 pm Post subject: FDX Chart Posted: Fri Dec 17, 2004 8:59 pm Post subject: FDX Chart |
 |
|
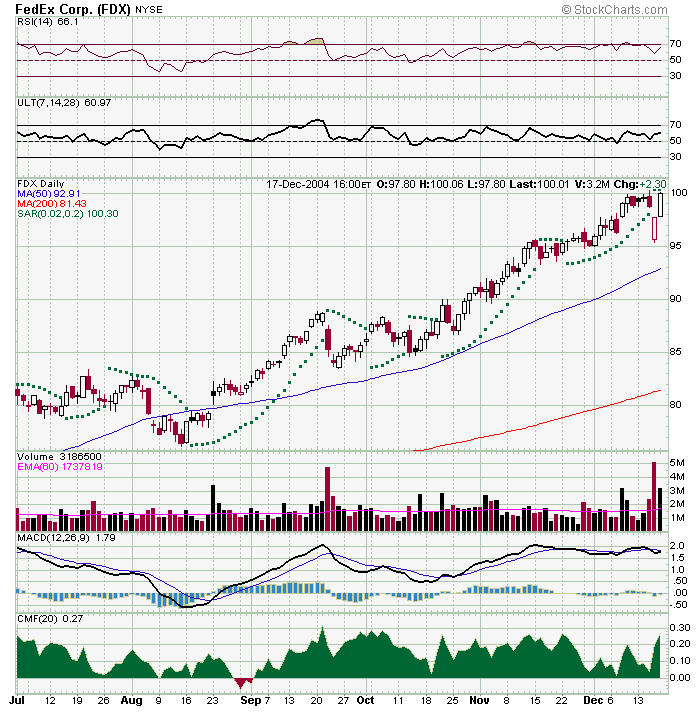
FDX fell below 96 on earnings Thu and then rallied on Fri closing at 100.01 (Max Pain). Although, the holiday season is a strong period for FDX, it may consolidate at current levels, since the seasonality may be discounted. The parabolic SAR shows a sell signal (two green dots above the highs Thu and Fri). So, FDX may become more volatile below 100, and pullback e.g. to 95. If FDX bounces e.g. to 102, it may be a head fake, and then may pullback.
 |
|
| Back to top |
|
 |
|
|
You cannot post new topics in this forum
You cannot reply to topics in this forum
You cannot edit your posts in this forum
You cannot delete your posts in this forum
You cannot vote in polls in this forum
|
|
 FAQ
FAQ Search
 Memberlist
 Usergroups
 Register
 Profile
 Log in to check your private messages
 Log in
