 |
PeakTrader.com
Economics, Portfolio Optimization, and Technical Analysis
|
| View previous topic :: View next topic |
| Author |
Message |
arthur
Guest
|
 Posted: Fri Dec 10, 2004 9:18 pm Post subject: KO chart (long-term hold) Posted: Fri Dec 10, 2004 9:18 pm Post subject: KO chart (long-term hold) |
 |
|
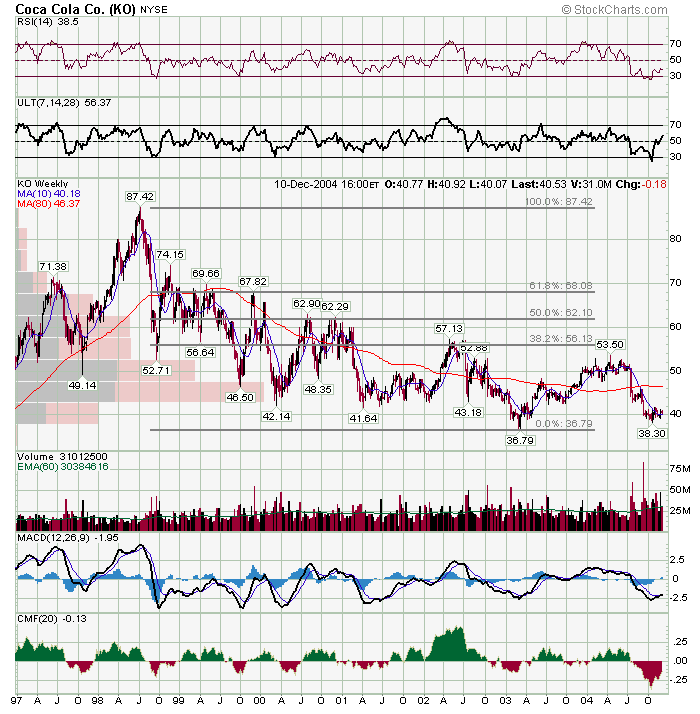
KO may be stabilizing and creating a double bottom in the high 30s. KO may rally to 45 (recent Price-by-Volume average), 50 (top of trading range), or 56 (38.2% Fibonacci level) sometime within the next year. KO has a strong brand and Warren Buffett's Berkshire Hathaway owns 200 million shares (or over 8% of shares outstanding). Consumer non-cyclicals may outperform the general market over the next few years, because the stock market is in a long-term structural bear market.
 |
|
| Back to top |
|
 |
|
|
You cannot post new topics in this forum
You cannot reply to topics in this forum
You cannot edit your posts in this forum
You cannot delete your posts in this forum
You cannot vote in polls in this forum
|
|
 FAQ
FAQ Search
 Memberlist
 Usergroups
 Register
 Profile
 Log in to check your private messages
 Log in
