 |
PeakTrader.com
Economics, Portfolio Optimization, and Technical Analysis
|
| View previous topic :: View next topic |
| Author |
Message |
arthur
Guest
|
 Posted: Fri Dec 10, 2004 9:18 pm Post subject: PPH chart (long-term hold) Posted: Fri Dec 10, 2004 9:18 pm Post subject: PPH chart (long-term hold) |
 |
|
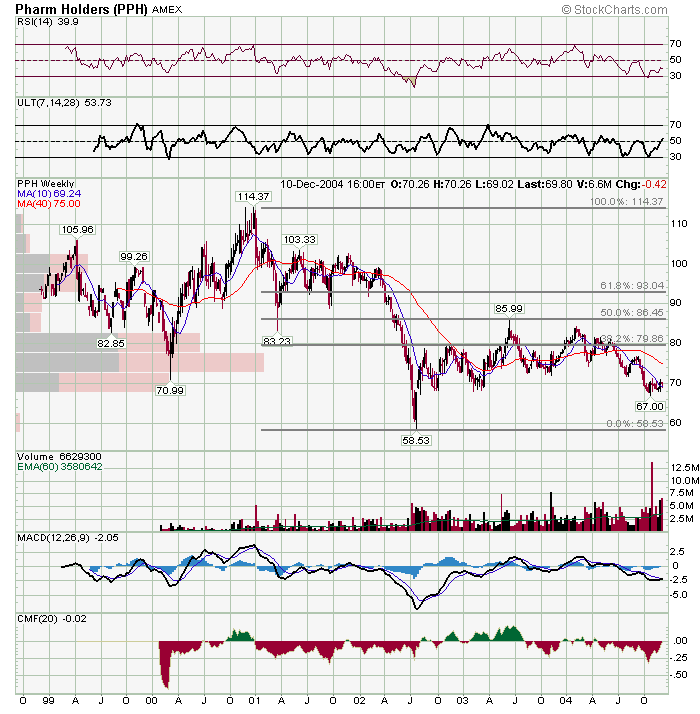
PPH is a pharma ETF, which includes PFE JNJ MRK GSK WYE BMY ABT SGP and others. The complete historical weekly chart below shows the Price-by-Volume average price has been around 75. PPH capitulated in mid-2002 and then rallied to about the 50% Fibonacci retracement within a year. Recently, it has consolidated around 70 for some time. PPH may rise over 10 points within a year, since drug stocks tend to outperform the general market at this stage of an economic recovery and it's relatively undervalued. Also, an ETF is safer than an individual stock. Consequently, there may be little risk. The PPH calls may be too low to write covered calls. The Jan 75 calls are at 0.20, the May 80 calls are at 0.40, and the Jan '06 80 calls are at 1.70. So, it may be best to wait for PPH to rise above 75 and then write out-of-the-money covered calls at a much higher price.
 |
|
| Back to top |
|
 |
|
|
You cannot post new topics in this forum
You cannot reply to topics in this forum
You cannot edit your posts in this forum
You cannot delete your posts in this forum
You cannot vote in polls in this forum
|
|
 FAQ
FAQ Search
 Memberlist
 Usergroups
 Register
 Profile
 Log in to check your private messages
 Log in
