PeakTrader.com Forum Index PeakTrader.com
Economics, Portfolio Optimization, and Technical Analysis
 
 FAQFAQ   SearchSearch   MemberlistMemberlist   UsergroupsUsergroups   RegisterRegister 
 ProfileProfile   Log in to check your private messagesLog in to check your private messages   Log inLog in 
Log inFast Charts

EBAY Comparison Chart

 
Post new topic   Reply to topic     PeakTrader.com Forum Index -> Top Stock Picks
View previous topic :: View next topic  
Author Message
administrator
Site Admin


Joined: 28 Dec 2005
Posts: 12643

PostPosted: Sun Aug 20, 2006 8:22 am    Post subject: EBAY Comparison Chart Reply with quote

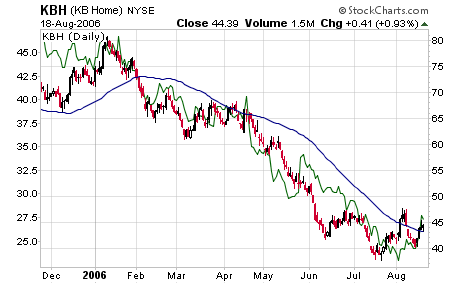
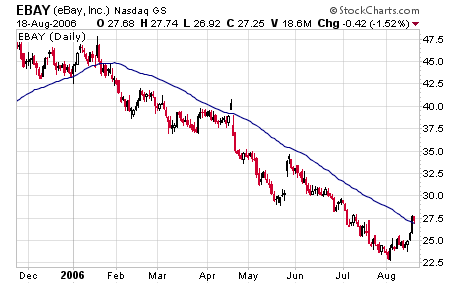
The first chart is a nine-month daily chart of KBH (candlesticks with 50-day MA, and right scale) and EBAY (green line, and left scale). Over 2006, KBH and EBAY fell by roughly same percentages. Homebuilders were ranked last in relative strength when KBH bottomed, and internets are currently ranked last. KBH may be leading EBAY by two weeks. In early Aug, KBH closed slightly above the 50-day MA, traded above that MA for several days, fell, and then rallied. If EBAY follows a similar pattern, it will fall to around 25, and rally again. The second chart shows EBAY held the 50-day MA Fri.


Back to top
View user's profile Send private message
Display posts from previous:   
Post new topic   Reply to topic     PeakTrader.com Forum Index -> Top Stock Picks All times are GMT - 8 Hours
Page 1 of 1

 
Jump to:  
You cannot post new topics in this forum
You cannot reply to topics in this forum
You cannot edit your posts in this forum
You cannot delete your posts in this forum
You cannot vote in polls in this forum


Powered by PeakTrader 2.0.8 © 2001, 2002