administrator
Site Admin
Joined: 28 Dec 2005
Posts: 12643
|
 Posted: Thu Apr 06, 2006 8:16 pm Post subject: Trading Metal Stocks Posted: Thu Apr 06, 2006 8:16 pm Post subject: Trading Metal Stocks |
 |
|
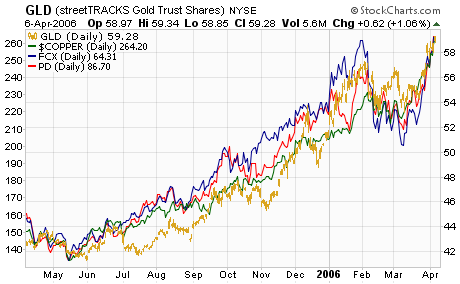
The chart below is a one year comparison chart of GLD, i.e. Price of Gold right scale and 59 for example equals $590 an ounce (gold line), the Price of Copper on left scale (green line), FCX (blue line), and PD (red line). FCX and PD produce copper and gold. Currently, the relative values of all four are equal. Gold rose to about 600 today (see new articles on PeakTrader Home Page News Room).
The GLD RSI and Oscillator are both above 70, which are severely overbought. However, gold may rise a little higher, perhaps to 620. Within two months, gold and copper prices may pullback sharply. There may be excellent opportunities to make big gains on volatility. The FCX and PD Apr options are much cheaper than May options, although of course May options are much safer. Perhaps, FCX Apr 65 and PD Apr 90 puts are buys when those stocks bounce.
 |
|

 FAQ
FAQ Search
 Memberlist
 Usergroups
 Register
 Profile
 Log in to check your private messages
 Log in


