 |
PeakTrader.com
Economics, Portfolio Optimization, and Technical Analysis
|
| View previous topic :: View next topic |
| Author |
Message |
arthur
Guest
|
 Posted: Mon Sep 05, 2005 9:12 am Post subject: DD Chart Posted: Mon Sep 05, 2005 9:12 am Post subject: DD Chart |
 |
|
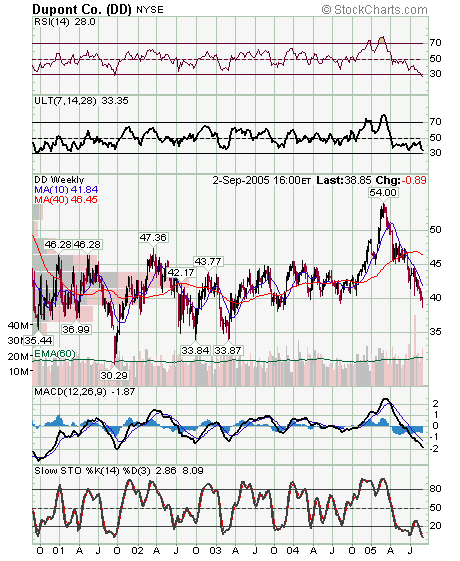
The DD five-year weekly chart shows a steep decline recently. The weekly RSI at 28 is the lowest RSI in over 15 years. Consequently, DD is more likely to bounce within the next few weeks than continue to fall. The lowest previous recent RSI was at 30, right after 9/11. DD may rise to 40 before Sep options expiration. Next major resistance is the 10 week MA currently at 41.84, and then around 42.50 (Price-by-Volume bar). DD may eventually test the recent lows at about 34. However, it may be oversold enough to bounce first.
 |
|
| Back to top |
|
 |
|
|
You cannot post new topics in this forum
You cannot reply to topics in this forum
You cannot edit your posts in this forum
You cannot delete your posts in this forum
You cannot vote in polls in this forum
|
|
 FAQ
FAQ Search
 Memberlist
 Usergroups
 Register
 Profile
 Log in to check your private messages
 Log in
