 |
PeakTrader.com
Economics, Portfolio Optimization, and Technical Analysis
|
| View previous topic :: View next topic |
| Author |
Message |
arthur
Guest
|
 Posted: Mon Sep 05, 2005 9:09 am Post subject: WMT Chart Posted: Mon Sep 05, 2005 9:09 am Post subject: WMT Chart |
 |
|
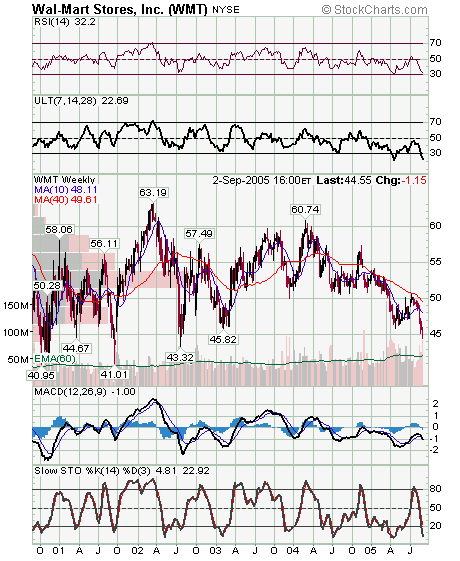
The WMT five-year weekly chart shows the lowest 40 week MA in 4 1/2 years, an oversold oscillator (ULT), and the stochastics in a steep decline, to a very low level. However, a bearish engulfing was created Fri (although on low volume without confirmation). So, if WMT pulls-back Mon, that may be an opportunity to buy long-term calls. Also, WMT may bounce to 47 1/2 within the next two weeks.
 |
|
| Back to top |
|
 |
|
|
You cannot post new topics in this forum
You cannot reply to topics in this forum
You cannot edit your posts in this forum
You cannot delete your posts in this forum
You cannot vote in polls in this forum
|
|
 FAQ
FAQ Search
 Memberlist
 Usergroups
 Register
 Profile
 Log in to check your private messages
 Log in
