 |
PeakTrader.com
Economics, Portfolio Optimization, and Technical Analysis
|
| View previous topic :: View next topic |
| Author |
Message |
arthur
Guest
|
 Posted: Fri Aug 26, 2005 3:57 pm Post subject: DD Chart (Updated) Posted: Fri Aug 26, 2005 3:57 pm Post subject: DD Chart (Updated) |
 |
|
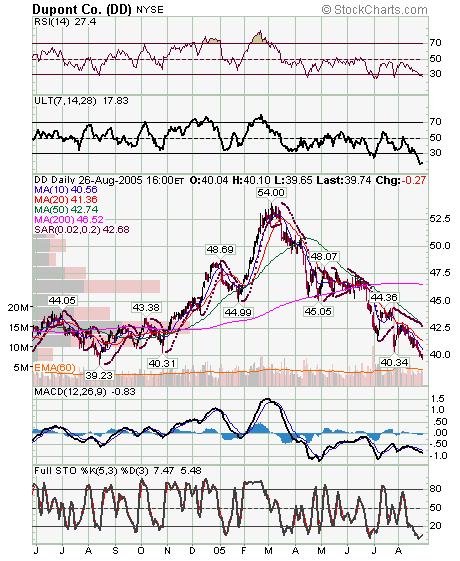
DD is a chemical and biotech firm. This top Dog of the Dow created a bearish engulfing Friday (although, it hasn't been confirmed) on top of a steep recent sell-off. However, the Oscillator (ULT) and the Stochastics are so oversold, that DD calls may be a buy on pullbacks (e.g. Sep 37.5 calls). Support is just above 39 (a previous low). Resistance is around 42 1/2 (50 day MA, Parabolic SAR sell signal, and Price-by-Volume bar).
 |
|
| Back to top |
|
 |
|
|
You cannot post new topics in this forum
You cannot reply to topics in this forum
You cannot edit your posts in this forum
You cannot delete your posts in this forum
You cannot vote in polls in this forum
|
|
 FAQ
FAQ Search
 Memberlist
 Usergroups
 Register
 Profile
 Log in to check your private messages
 Log in
