 |
PeakTrader.com
Economics, Portfolio Optimization, and Technical Analysis
|
| View previous topic :: View next topic |
| Author |
Message |
arthur
Guest
|
 Posted: Wed Jun 15, 2005 12:54 pm Post subject: OIH Chart Posted: Wed Jun 15, 2005 12:54 pm Post subject: OIH Chart |
 |
|
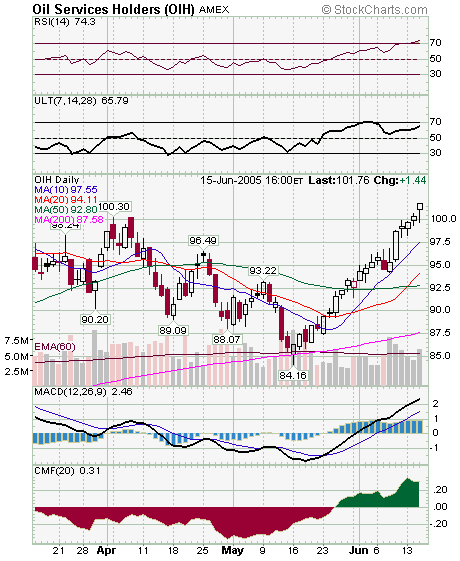
OIH would have to rise and hold 102 for a triple top breakout. So, 102 is major resistance. Major support levels are 100.30 (two previous tops), the low after Thu's white candle at 98, and the 10 day MA at over 97 1/2. The steep rise suggests either a consolidation or correction. Perhaps, OIH will be in a 98 to 102 range over the next week. Of course, oil prices are a big factor in the stock's price.
 |
|
| Back to top |
|
 |
|
|
You cannot post new topics in this forum
You cannot reply to topics in this forum
You cannot edit your posts in this forum
You cannot delete your posts in this forum
You cannot vote in polls in this forum
|
|
 FAQ
FAQ Search
 Memberlist
 Usergroups
 Register
 Profile
 Log in to check your private messages
 Log in
