 |
PeakTrader.com
Economics, Portfolio Optimization, and Technical Analysis
|
| View previous topic :: View next topic |
| Author |
Message |
arthur
Guest
|
 Posted: Wed Jun 15, 2005 12:48 pm Post subject: GOOG Chart Posted: Wed Jun 15, 2005 12:48 pm Post subject: GOOG Chart |
 |
|
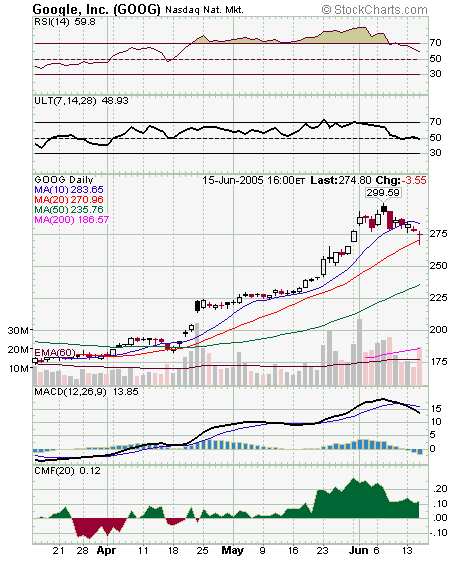
The daily chart shows GOOG created a bullish doji today. However, it's below the bearish head & shoulders at 275, which is major resistance. Major support is in the 250s and 260s, which is a small congestion area, and then the 220s, which is a consolidation area. There's an open gap at 293, and a retest of the top at 299 is possible. It seems, GOOG closed in the middle of a 250 to 300 short-term range today, which may explain the (indecisive) doji.
 |
|
| Back to top |
|
 |
|
|
You cannot post new topics in this forum
You cannot reply to topics in this forum
You cannot edit your posts in this forum
You cannot delete your posts in this forum
You cannot vote in polls in this forum
|
|
 FAQ
FAQ Search
 Memberlist
 Usergroups
 Register
 Profile
 Log in to check your private messages
 Log in
