PeakTrader.com Forum Index PeakTrader.com
Economics, Portfolio Optimization, and Technical Analysis
 
 FAQFAQ   SearchSearch   MemberlistMemberlist   UsergroupsUsergroups   RegisterRegister 
 ProfileProfile   Log in to check your private messagesLog in to check your private messages   Log inLog in 
Log inFast Charts

AMAT Chart

 
Post new topic   Reply to topic     PeakTrader.com Forum Index -> Top Stock Picks
View previous topic :: View next topic  
Author Message
arthur
Guest


PostPosted: Sun May 08, 2005 7:03 am    Post subject: AMAT Chart Reply with quote

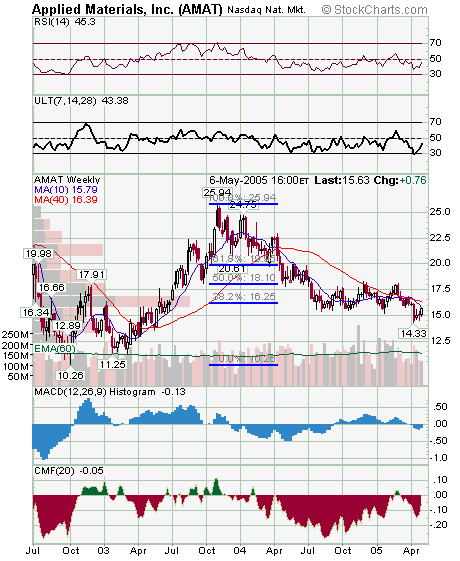
The weekly chart shows AMAT hit a post Nasdaq bubble low at 10.26 in Oct '02, then rallied to 25.94 in Jan '04, and has since retraced over 61.8% of that rally. AMAT may be a buy on a small pullback, e.g. to 15.25, since there may be more upside than downside short-term, or at least a one point bounce to 16.25 within a week.

Back to top
Display posts from previous:   
Post new topic   Reply to topic     PeakTrader.com Forum Index -> Top Stock Picks All times are GMT - 8 Hours
Page 1 of 1

 
Jump to:  
You cannot post new topics in this forum
You cannot reply to topics in this forum
You cannot edit your posts in this forum
You cannot delete your posts in this forum
You cannot vote in polls in this forum


Powered by PeakTrader 2.0.8 © 2001, 2002