 |
PeakTrader.com
Economics, Portfolio Optimization, and Technical Analysis
|
| View previous topic :: View next topic |
| Author |
Message |
arthur
Guest
|
 Posted: Sat Apr 09, 2005 6:45 pm Post subject: OIH Chart Posted: Sat Apr 09, 2005 6:45 pm Post subject: OIH Chart |
 |
|
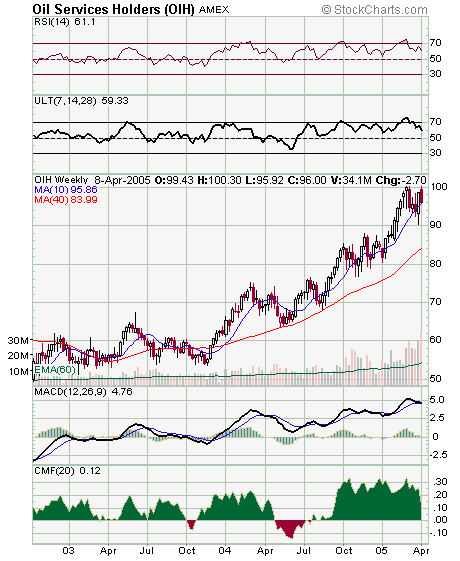
The OIH weekly chart shows both the RSI and Oscillator (ULT) were both severely overbought twice recently (also shown in Feb 27th and Mar 5th Market Overview sections), which led to sell-offs both times. Currently, Federal Reserve policy is to "talk down" oil prices, which may indicate the OIH rally is over. Consequently, OIH may fall to 90 again, short-term, and then test the 40 week MA, at 84. So, it may be best to buy Jul puts above 97 and May puts above 98.
 |
|
| Back to top |
|
 |
|
|
You cannot post new topics in this forum
You cannot reply to topics in this forum
You cannot edit your posts in this forum
You cannot delete your posts in this forum
You cannot vote in polls in this forum
|
|
 FAQ
FAQ Search
 Memberlist
 Usergroups
 Register
 Profile
 Log in to check your private messages
 Log in
