 |
PeakTrader.com
Economics, Portfolio Optimization, and Technical Analysis
|
| View previous topic :: View next topic |
| Author |
Message |
arthur
Guest
|
 Posted: Sat Apr 02, 2005 4:11 pm Post subject: AIG Chart Posted: Sat Apr 02, 2005 4:11 pm Post subject: AIG Chart |
 |
|
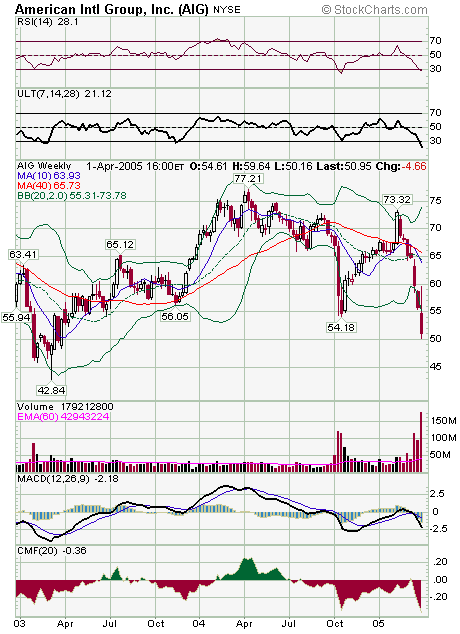
AIG, a Dow component, fell sharply recently, because of possible obstruction of justice charges, to go with its accounting scandal. Even with criminal charges, AIG may bounce short-term. The weekly chart shows a severely oversold oscillator (ULT). Also, the current price is outside the outer limit of the 20 week Bollinger Bands. Moreover, AIG is a long-term hold, because the potential criminal charges are unlikely to affect earnings substantially.
 |
|
| Back to top |
|
 |
|
|
You cannot post new topics in this forum
You cannot reply to topics in this forum
You cannot edit your posts in this forum
You cannot delete your posts in this forum
You cannot vote in polls in this forum
|
|
 FAQ
FAQ Search
 Memberlist
 Usergroups
 Register
 Profile
 Log in to check your private messages
 Log in
