PeakTrader.com Forum Index PeakTrader.com
Economics, Portfolio Optimization, and Technical Analysis
 
 FAQFAQ   SearchSearch   MemberlistMemberlist   UsergroupsUsergroups   RegisterRegister 
 ProfileProfile   Log in to check your private messagesLog in to check your private messages   Log inLog in 
Log inFast Charts

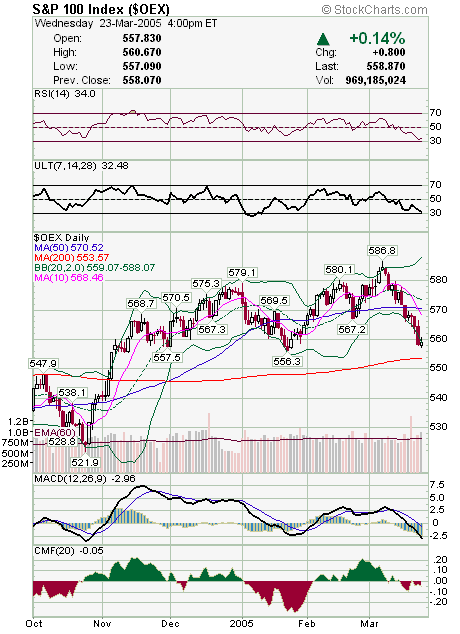
OEX Chart

 
Post new topic   Reply to topic     PeakTrader.com Forum Index -> Top Stock Picks
View previous topic :: View next topic  
Author Message
arthur
Guest


PostPosted: Wed Mar 23, 2005 4:26 pm    Post subject: OEX Chart Reply with quote

OEX held 557 today, which was an area of previous support twice before recently. The 10 day MA at 568 is short-term resistance. However, the sell-off has been so steep, that a V-shape may be completed within the next few weeks, on a close above the 50 day MA and middle of Bollinger Band (i.e. 20 day MA).

Back to top
Display posts from previous:   
Post new topic   Reply to topic     PeakTrader.com Forum Index -> Top Stock Picks All times are GMT - 8 Hours
Page 1 of 1

 
Jump to:  
You cannot post new topics in this forum
You cannot reply to topics in this forum
You cannot edit your posts in this forum
You cannot delete your posts in this forum
You cannot vote in polls in this forum


Powered by PeakTrader 2.0.8 © 2001, 2002