 |
PeakTrader.com
Economics, Portfolio Optimization, and Technical Analysis
|
| View previous topic :: View next topic |
| Author |
Message |
arthur
Guest
|
 Posted: Sun Mar 27, 2005 7:28 am Post subject: SLB Chart Posted: Sun Mar 27, 2005 7:28 am Post subject: SLB Chart |
 |
|
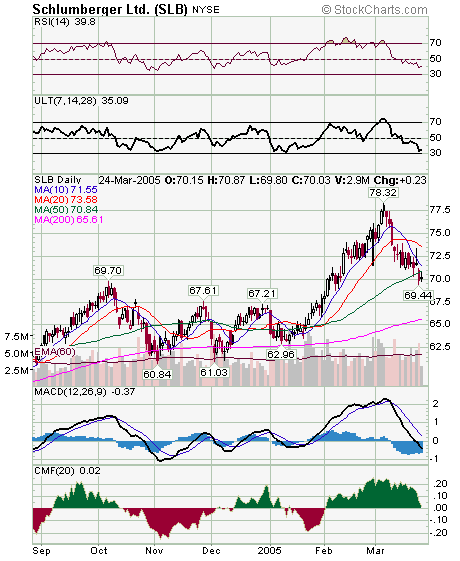
Oil stocks tend to move on anticipation of oil prices. SLB, a large oil service and equipment stock, started to fall when oil prices peaked at over $58 a barrel about two weeks ago. Oil closed at about $55 a barrel Thu, and may fall to just below $50 a barrel short-term. SLB may bounce two points, to 72, next week on end-of-the-quarter window dressing. It's uncertain if lower oil prices are priced-into the stock. So, perhaps, SLB will either hold 69.70 (2004 high and breakout point) or fall to the 200 day MA at around 66.
 |
|
| Back to top |
|
 |
|
|
You cannot post new topics in this forum
You cannot reply to topics in this forum
You cannot edit your posts in this forum
You cannot delete your posts in this forum
You cannot vote in polls in this forum
|
|
 FAQ
FAQ Search
 Memberlist
 Usergroups
 Register
 Profile
 Log in to check your private messages
 Log in
