 |
PeakTrader.com
Economics, Portfolio Optimization, and Technical Analysis
|
| View previous topic :: View next topic |
| Author |
Message |
arthur
Guest
|
 Posted: Sun Mar 20, 2005 7:02 am Post subject: OSIP Chart Posted: Sun Mar 20, 2005 7:02 am Post subject: OSIP Chart |
 |
|
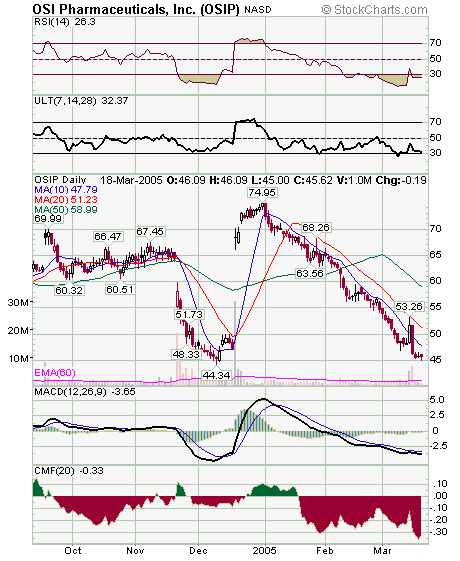
OSIP is a smaller cap biotech (market cap about $2 1/2 billion) that has a pipeline of oncology drugs (treatment of tumors). Currently, OSIP is testing the recent low. Resistance is at the 10 and 20 day MAs. A breakout above the 20 day MA may be bullish.
One strategy is to buy Apr 40 calls and wait for a two point bounce to buy Apr 45 or 50 puts, or sell half of the Apr 40 calls on the bounce. Some combination of calls and puts may be traded, on volatility, to manage risk (in case OSIP falls sharply), while making small gains, and being in position to make a big net gain in case OSIP rallies or falls 20 points.
 |
|
| Back to top |
|
 |
|
|
You cannot post new topics in this forum
You cannot reply to topics in this forum
You cannot edit your posts in this forum
You cannot delete your posts in this forum
You cannot vote in polls in this forum
|
|
 FAQ
FAQ Search
 Memberlist
 Usergroups
 Register
 Profile
 Log in to check your private messages
 Log in
