 |
PeakTrader.com
Economics, Portfolio Optimization, and Technical Analysis
|
| View previous topic :: View next topic |
| Author |
Message |
arthur
Guest
|
 Posted: Thu Mar 10, 2005 5:32 pm Post subject: BBH Chart Posted: Thu Mar 10, 2005 5:32 pm Post subject: BBH Chart |
 |
|
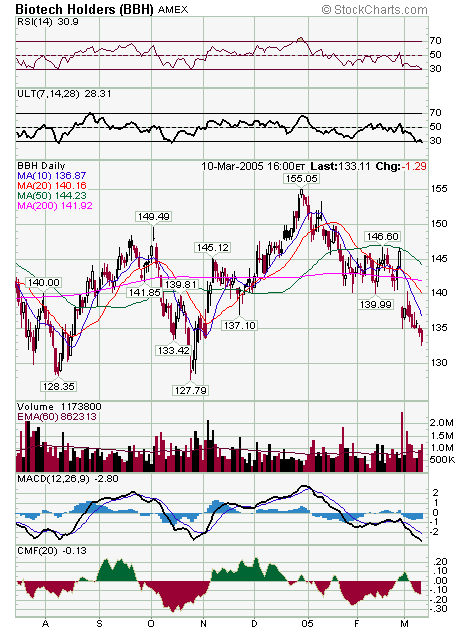
The BBH chart shows RSI ULT (oscillator) and MACD are all near severely oversold levels. Consequently, there's little risk buying at the current price. Major resistance is at 135 (area of previous lows) and 136 3/4 (10 day MA). It's possible BBH will fall further to around 130 and then bounce to 135. However, the Mar Max Pain point is 135, which indicates BBH will more likely trade around 135.
 |
|
| Back to top |
|
 |
|
|
You cannot post new topics in this forum
You cannot reply to topics in this forum
You cannot edit your posts in this forum
You cannot delete your posts in this forum
You cannot vote in polls in this forum
|
|
 FAQ
FAQ Search
 Memberlist
 Usergroups
 Register
 Profile
 Log in to check your private messages
 Log in
