 |
PeakTrader.com
Economics, Portfolio Optimization, and Technical Analysis
|
| View previous topic :: View next topic |
| Author |
Message |
arthur
Guest
|
 Posted: Tue Feb 22, 2005 5:06 pm Post subject: BBH Chart Posted: Tue Feb 22, 2005 5:06 pm Post subject: BBH Chart |
 |
|
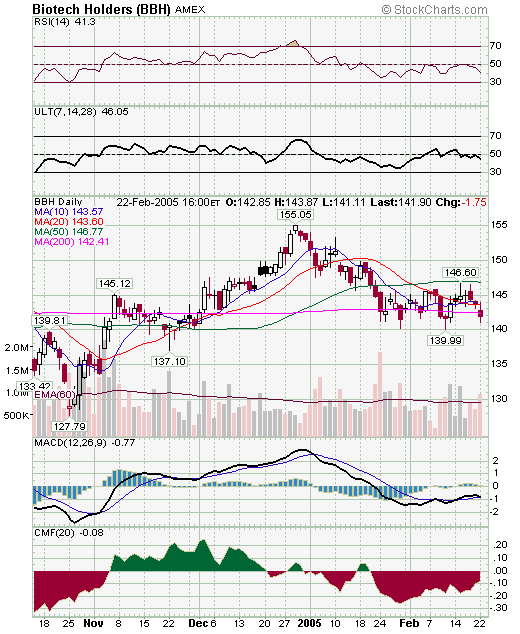
BTK (a biotech index) created a bullish inverse head & shoulders pattern, last year, while BBH (a biotech ETF) created a double bottom (both charts shown before). BBH held 140 over the 2005 sell-off, and may continue to trade between 140 and 145 short-term. Also, BBH may be an excellent long-term hold, including for writing covered calls, e.g. buying BBH near 140 and writing Mar 145 calls near 145.
 |
|
| Back to top |
|
 |
|
|
You cannot post new topics in this forum
You cannot reply to topics in this forum
You cannot edit your posts in this forum
You cannot delete your posts in this forum
You cannot vote in polls in this forum
|
|
 FAQ
FAQ Search
 Memberlist
 Usergroups
 Register
 Profile
 Log in to check your private messages
 Log in
