 |
PeakTrader.com
Economics, Portfolio Optimization, and Technical Analysis
|
| View previous topic :: View next topic |
| Author |
Message |
arthur
Guest
|
 Posted: Sat Feb 19, 2005 9:14 am Post subject: XOMA Chart Posted: Sat Feb 19, 2005 9:14 am Post subject: XOMA Chart |
 |
|
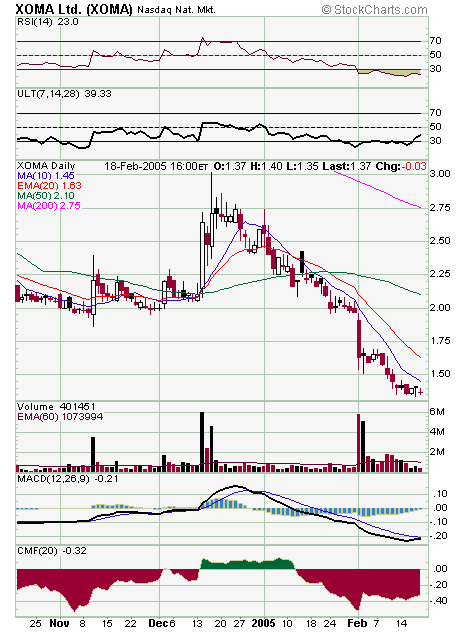
XOMA, small-cap biotech, is showing signs of bottoming and may be in position to bounce big. The doji Fri on low volume after the steep 2005 sell-off is bullish. Also, RSI is severely oversold and Money Flow is less negative. The 10 day MA is short-term resistance. However, volatility may pick-up over the next few trading days, which may break the 10 day MA resistance level. Major resistance is at 1.50 and the 20 day MA.
 |
|
| Back to top |
|
 |
|
|
You cannot post new topics in this forum
You cannot reply to topics in this forum
You cannot edit your posts in this forum
You cannot delete your posts in this forum
You cannot vote in polls in this forum
|
|
 FAQ
FAQ Search
 Memberlist
 Usergroups
 Register
 Profile
 Log in to check your private messages
 Log in
