 |
PeakTrader.com
Economics, Portfolio Optimization, and Technical Analysis
|
| View previous topic :: View next topic |
| Author |
Message |
arthur
Guest
|
 Posted: Mon Feb 07, 2005 8:39 pm Post subject: HMY Chart Posted: Mon Feb 07, 2005 8:39 pm Post subject: HMY Chart |
 |
|
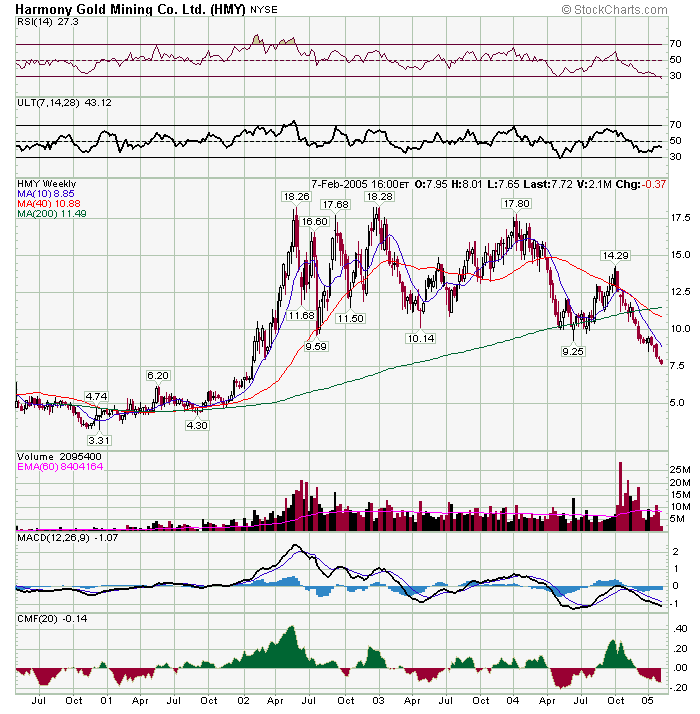
The weekly HMY chart (with 200 week MA) reflects the gold structural bull market, although gold prices have been in a correction. Technical analysts would predict HMY will fall to $5 a share, i.e. to the pre-bull market price area. Also, HMY (and DROOY) fell sharply recently on the strong South African Rand. Moreover, HMY is trying to buy GFI (Gold Fields stock). The current HMY offer price is less than GFI's stock price. So, there's speculation HMY will sweeten its offer for GFI. Furthermore, there's uncertainty, because HMY stated it will not pay more than its offer price (which currently makes no sense). So, there's a lot of negative news already priced into the stock.
 |
|
| Back to top |
|
 |
|
|
You cannot post new topics in this forum
You cannot reply to topics in this forum
You cannot edit your posts in this forum
You cannot delete your posts in this forum
You cannot vote in polls in this forum
|
|
 FAQ
FAQ Search
 Memberlist
 Usergroups
 Register
 Profile
 Log in to check your private messages
 Log in
