 |
PeakTrader.com
Economics, Portfolio Optimization, and Technical Analysis
|
| View previous topic :: View next topic |
| Author |
Message |
arthur
Guest
|
 Posted: Sat Feb 05, 2005 11:43 am Post subject: TLT Chart Posted: Sat Feb 05, 2005 11:43 am Post subject: TLT Chart |
 |
|
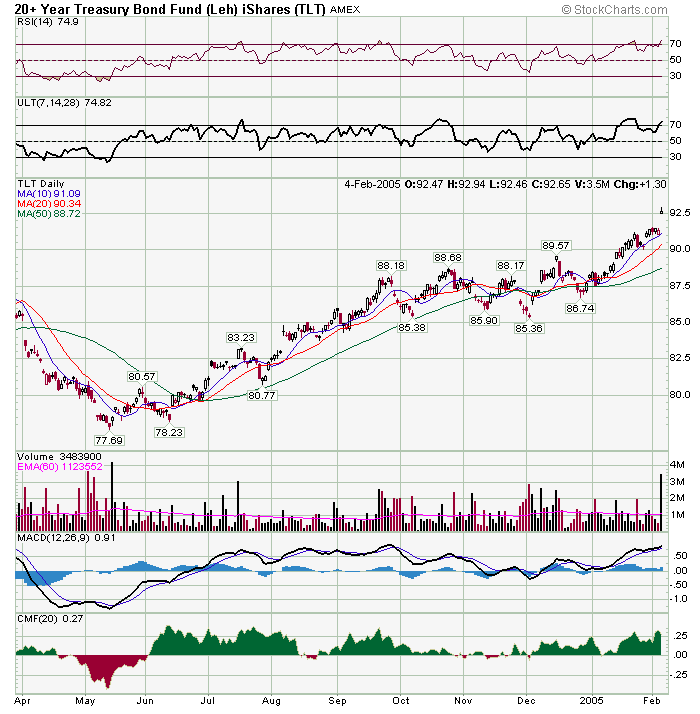
TLT (long-term bond ETF) may have created a "blow-off" top Fri. Consequently, there may be a pullback to the 10 or 20 day MA sometime next week. TLT was heavily shorted and many of those shorts were covered Fri. Currently, there may be little risk with Feb in-the-money puts. Both the bond and stock markets turned a negative employment report Fri into a positive Fed tightening pause. However, perhaps, next week, the market will realize this assumption is too optimistic. So, perhaps, large gains can be made buying Feb 93 or 92 puts Mon morning, if TLT opens a little high.
 |
|
| Back to top |
|
 |
|
|
You cannot post new topics in this forum
You cannot reply to topics in this forum
You cannot edit your posts in this forum
You cannot delete your posts in this forum
You cannot vote in polls in this forum
|
|
 FAQ
FAQ Search
 Memberlist
 Usergroups
 Register
 Profile
 Log in to check your private messages
 Log in
