 |
PeakTrader.com
Economics, Portfolio Optimization, and Technical Analysis
|
| View previous topic :: View next topic |
| Author |
Message |
arthur
Guest
|
 Posted: Thu Feb 03, 2005 8:21 pm Post subject: OIH Chart Posted: Thu Feb 03, 2005 8:21 pm Post subject: OIH Chart |
 |
|
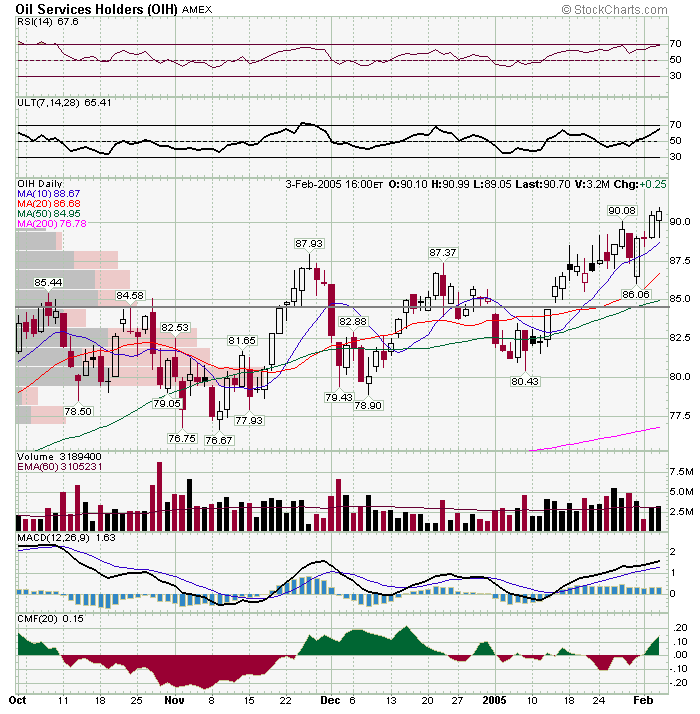
OIH hit a one-year high today (the all-time high was 100 3/4 in mid-2000). Yet, oil fell below $47 a barrel today (oil hit $55 a barrel in late Oct). The five month daily chart shows a volatile trading range after OIH rallied earlier in 2004. Currently, OIH's put/call is 2.13 and short interest ratio is 6.16. Both are above average for an ETF, but not overly excessive. Feb Max Pain is 85 with the value of calls exceeding puts. Consequently, OIH may fall to around 85 sometime before Feb options expiration. OIH also has a gap to close just below 85 (that was also an island reversal, see line), which is major support. The previous high at 100 3/4 is major resistance. I've noticed each time OIH fell sharply, there was heavy buying. So, perhaps trading both calls and puts will eventually yield gains on both, since OIH is volatile. The OIH Feb 90 puts closed at 1.30 today. A significant support level is just below 88, although OIH may fall lower depending on oil prices (OIH led oil prices higher and lower late last year). It's possible OIH will rally higher. However, Feb 90 puts may be a buy, since they're cheap and could double or triple quickly, and sold when OIH falls to 88, and if OIH falls lower, e.g. to 85, then perhaps, Mar 90 calls would be a buy. The Feb options expire in 11 trading days and a lot can happen before then.
 |
|
| Back to top |
|
 |
|
|
You cannot post new topics in this forum
You cannot reply to topics in this forum
You cannot edit your posts in this forum
You cannot delete your posts in this forum
You cannot vote in polls in this forum
|
|
 FAQ
FAQ Search
 Memberlist
 Usergroups
 Register
 Profile
 Log in to check your private messages
 Log in
