 |
PeakTrader.com
Economics, Portfolio Optimization, and Technical Analysis
|
| View previous topic :: View next topic |
| Author |
Message |
arthur
Guest
|
 Posted: Mon Jan 24, 2005 4:04 pm Post subject: QQQQ Chart Posted: Mon Jan 24, 2005 4:04 pm Post subject: QQQQ Chart |
 |
|
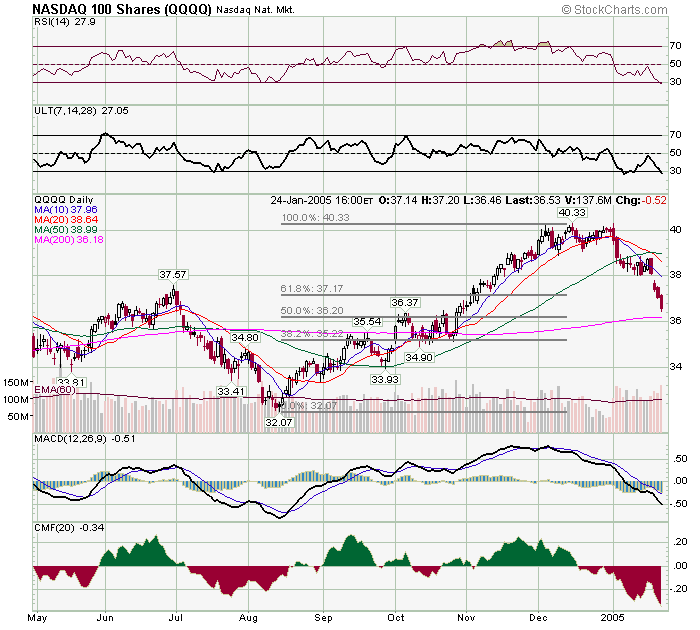
QQQQ is down 3 1/2 points in Jan (a one point QQQQ move normally equals roughly a 40 point Nasdaq move). Selling accelerated over the past few days (see volume), because stops are being executed. Currently, the RSI and ULT (oscillator) are both below 28, which is severely oversold. QQQQ major resistance is at 37.17 (61.8% Fibonacci level). If QQQQ can close above that level, then 38 (Thu's gap) is next resistance. Major support is at 36.20, where the 50% Fibonacci level and the 200 day MA work together to provide strong support. Today was the first day after Jan options expire (also, today would normally be a good day to buy QQQQ Feb calls, i.e. right after Jan expiration and on a big down day). So, I'm not too worried about holding QQQQ Feb calls, because Nasdaq can move fast.
 |
|
| Back to top |
|
 |
|
|
You cannot post new topics in this forum
You cannot reply to topics in this forum
You cannot edit your posts in this forum
You cannot delete your posts in this forum
You cannot vote in polls in this forum
|
|
 FAQ
FAQ Search
 Memberlist
 Usergroups
 Register
 Profile
 Log in to check your private messages
 Log in
