PeakTrader.com Forum Index PeakTrader.com
Economics, Portfolio Optimization, and Technical Analysis
 
 FAQFAQ   SearchSearch   MemberlistMemberlist   UsergroupsUsergroups   RegisterRegister 
 ProfileProfile   Log in to check your private messagesLog in to check your private messages   Log inLog in 
Log inFast Charts

RFMD Chart

 
Post new topic   Reply to topic     PeakTrader.com Forum Index -> Top Stock Picks
View previous topic :: View next topic  
Author Message
arthur
Guest


PostPosted: Fri Jan 21, 2005 8:48 pm    Post subject: RFMD Chart Reply with quote

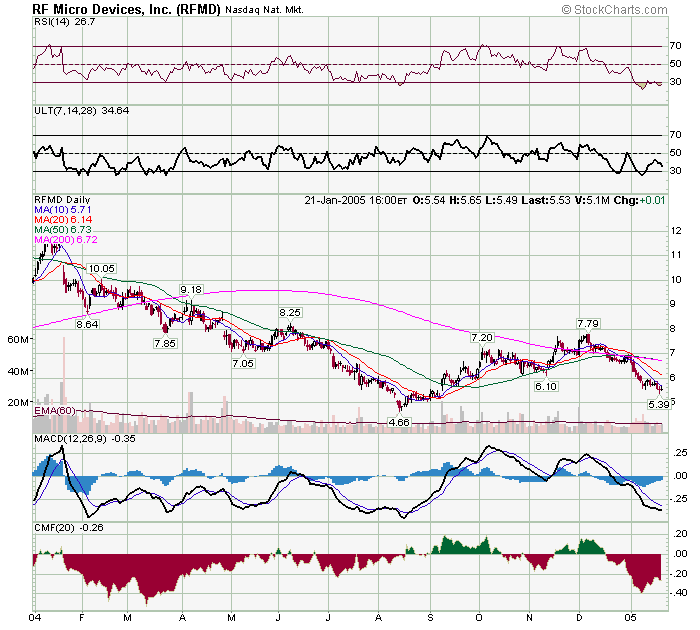
RFMD, a semiconductor, fell sharply in 2005, and reports earnings Tue. The MACD histogram (blue area) suggests an upturn. RFMD closed at 5.53 Fri. Resistance is at 6.14 (20 day MA and the area where heavy selling stopped) and 6.72 (where the 50 and 200 day MAs work together).

Back to top
Display posts from previous:   
Post new topic   Reply to topic     PeakTrader.com Forum Index -> Top Stock Picks All times are GMT - 8 Hours
Page 1 of 1

 
Jump to:  
You cannot post new topics in this forum
You cannot reply to topics in this forum
You cannot edit your posts in this forum
You cannot delete your posts in this forum
You cannot vote in polls in this forum


Powered by PeakTrader 2.0.8 © 2001, 2002