 |
PeakTrader.com
Economics, Portfolio Optimization, and Technical Analysis
|
| View previous topic :: View next topic |
| Author |
Message |
arthur
Guest
|
 Posted: Thu Jan 20, 2005 3:09 pm Post subject: OEX Chart Posted: Thu Jan 20, 2005 3:09 pm Post subject: OEX Chart |
 |
|
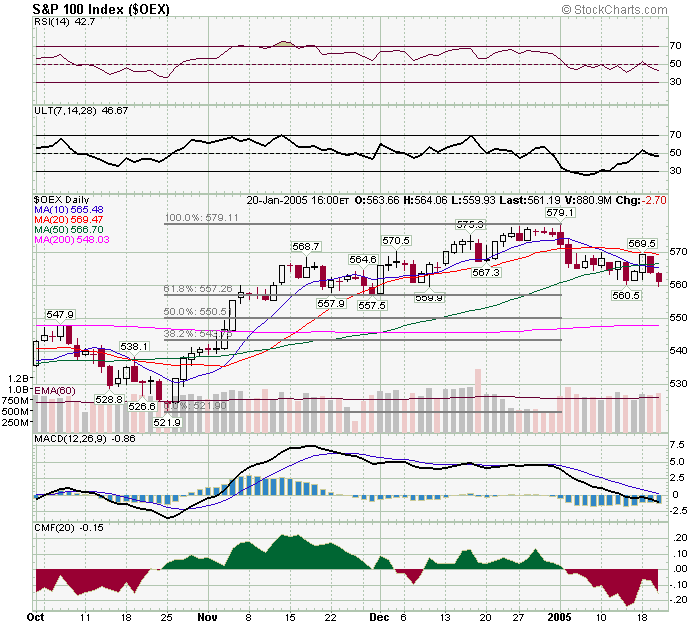
OEX is currently near major support (i.e. the recent consolidation area). The 61.8% Fibonacci level of the recent rally at 557 is also major support. Major resistance is at the 10 and 50 day MAs (around 566, which work together to create resistance). OEX may outperform SPX, since larger caps underperformed smaller caps over the past six years, in part because interest rates were low. So, I tend to believe, OEX will trade between 560 and 566 Fri and there may be opportunities to make gains with Jan in-the-money calls and then perhaps Jan in-the-money puts. OEX Jan Max Pain at the close today is still 565.
 |
|
| Back to top |
|
 |
|
|
You cannot post new topics in this forum
You cannot reply to topics in this forum
You cannot edit your posts in this forum
You cannot delete your posts in this forum
You cannot vote in polls in this forum
|
|
 FAQ
FAQ Search
 Memberlist
 Usergroups
 Register
 Profile
 Log in to check your private messages
 Log in
