 |
PeakTrader.com
Economics, Portfolio Optimization, and Technical Analysis
|
| View previous topic :: View next topic |
| Author |
Message |
arthur
Guest
|
 Posted: Mon Jan 17, 2005 1:46 pm Post subject: QQQQ Chart Posted: Mon Jan 17, 2005 1:46 pm Post subject: QQQQ Chart |
 |
|
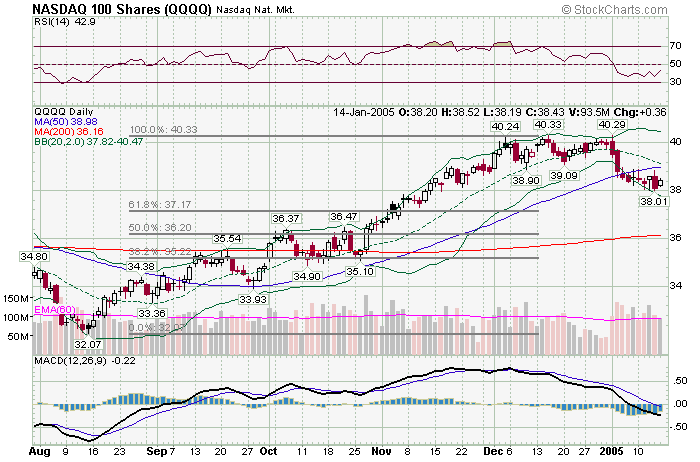
The 50 day MA and middle of Bollinger Band (20 day MA) work together to provide significant resistance at around 39. Also, the second big down day after two big down days in a row at about 39 is a resistance level. The QQQQ 2004 low is 32.07, and the 61.8% Fibonacci level at 37.17 may be tested. Short-term, QQQQ held roughly 38. Perhaps, QQQQ will trade between just below 38 to about 39 next week.
 |
|
| Back to top |
|
 |
|
|
You cannot post new topics in this forum
You cannot reply to topics in this forum
You cannot edit your posts in this forum
You cannot delete your posts in this forum
You cannot vote in polls in this forum
|
|
 FAQ
FAQ Search
 Memberlist
 Usergroups
 Register
 Profile
 Log in to check your private messages
 Log in
