 |
PeakTrader.com
Economics, Portfolio Optimization, and Technical Analysis
|
| View previous topic :: View next topic |
| Author |
Message |
arthur
Guest
|
 Posted: Tue Jan 04, 2005 4:10 pm Post subject: NEM Chart (update) Posted: Tue Jan 04, 2005 4:10 pm Post subject: NEM Chart (update) |
 |
|
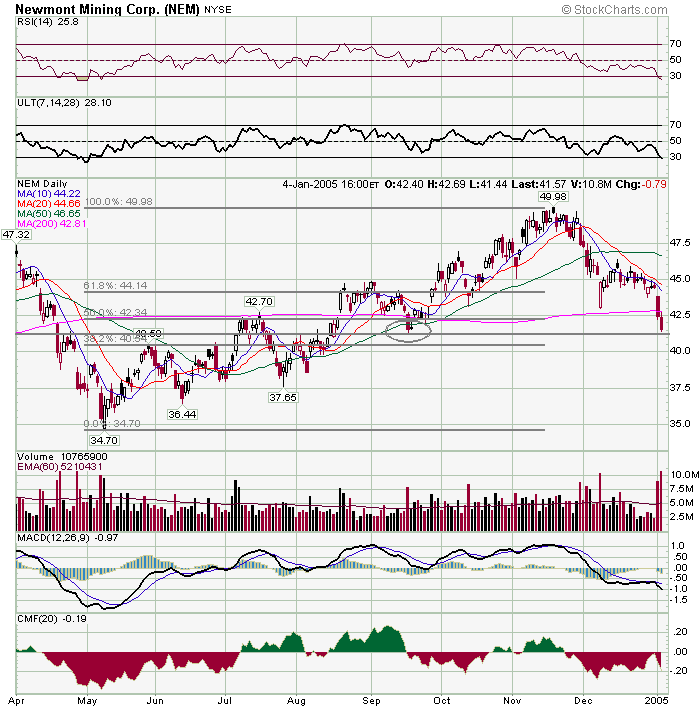
Fibonacci levels tend to work better for indices than individual stocks. However, NEM has been the gold leader (XAU gold index doesn't record volume). Gold stocks had a severe correction in early 2004 and then rallied most of last year. However, NEM is already going through another correction. NEM closed just above a previous low (see circle). Next major support is at the 38.2% Fibonacci level at 40.54. Next major resistance is around 42 1/2 (50% Fibonacci level and 200 day MA). However, there is also a gap to close at just over 44, which is also the 61.8% Fibonacci level and the 10 & 20 day MAs. Gold typically moves for several reasons: 1) As a hedge for inflation, 2) As a hedge for the depreciating U.S. dollar (since gold is priced in U.S. dollars on the world market), and 3) As insurance against negative global shocks.
 |
|
| Back to top |
|
 |
|
|
You cannot post new topics in this forum
You cannot reply to topics in this forum
You cannot edit your posts in this forum
You cannot delete your posts in this forum
You cannot vote in polls in this forum
|
|
 FAQ
FAQ Search
 Memberlist
 Usergroups
 Register
 Profile
 Log in to check your private messages
 Log in
