 |
PeakTrader.com
Economics, Portfolio Optimization, and Technical Analysis
|
| View previous topic :: View next topic |
| Author |
Message |
arthur
Guest
|
 Posted: Tue Dec 28, 2004 6:57 pm Post subject: FMDAY Chart Posted: Tue Dec 28, 2004 6:57 pm Post subject: FMDAY Chart |
 |
|
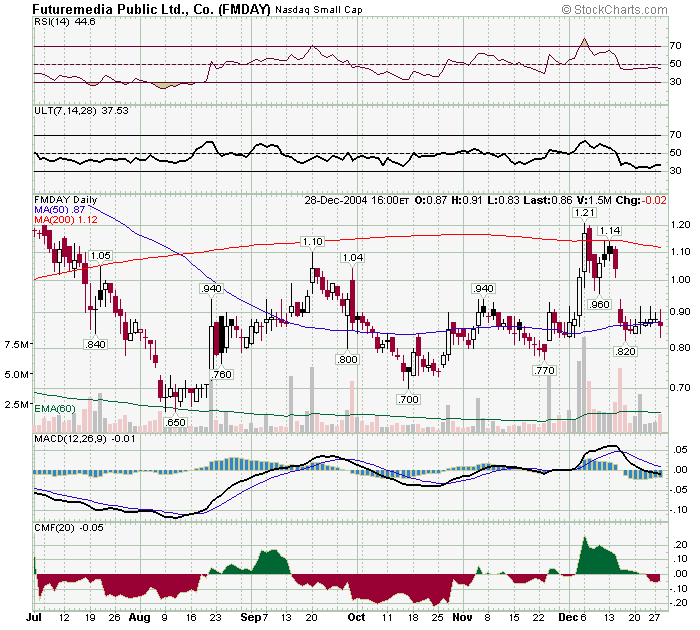
The FMDAY daily chart shows a large recent gap, when earnings were reported. Consequently, there has been resistance at around 0.90. However, there has also been significant support at 0.82. FMDAY has been making higher highs and higher lows, causing the 50 day MA to flatten. I bailed-out of FMDAY, at 0.87, because I didn't believe there would be enough volatility to trade for a while. If FMDAY falls to 0.82 or 0.83 that may be an opportunity to buy a small position. If FMDAY falls lower, e.g. to 0.75, that may be an opportunity to buy a larger position. Longer-term, FMDAY may rally well above 1.20, perhaps on stronger fourth quarter earnings and 2005 earnings expectations.
 |
|
| Back to top |
|
 |
|
|
You cannot post new topics in this forum
You cannot reply to topics in this forum
You cannot edit your posts in this forum
You cannot delete your posts in this forum
You cannot vote in polls in this forum
|
|
 FAQ
FAQ Search
 Memberlist
 Usergroups
 Register
 Profile
 Log in to check your private messages
 Log in
