 |
PeakTrader.com
Economics, Portfolio Optimization, and Technical Analysis
|
| View previous topic :: View next topic |
| Author |
Message |
arthur
Guest
|
 Posted: Tue Dec 28, 2004 6:22 pm Post subject: SOX INTC & MXIM Charts Posted: Tue Dec 28, 2004 6:22 pm Post subject: SOX INTC & MXIM Charts |
 |
|
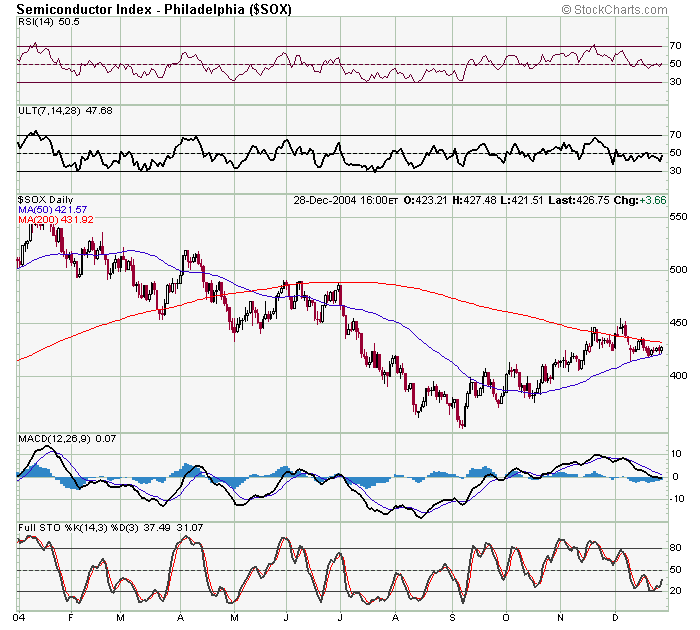
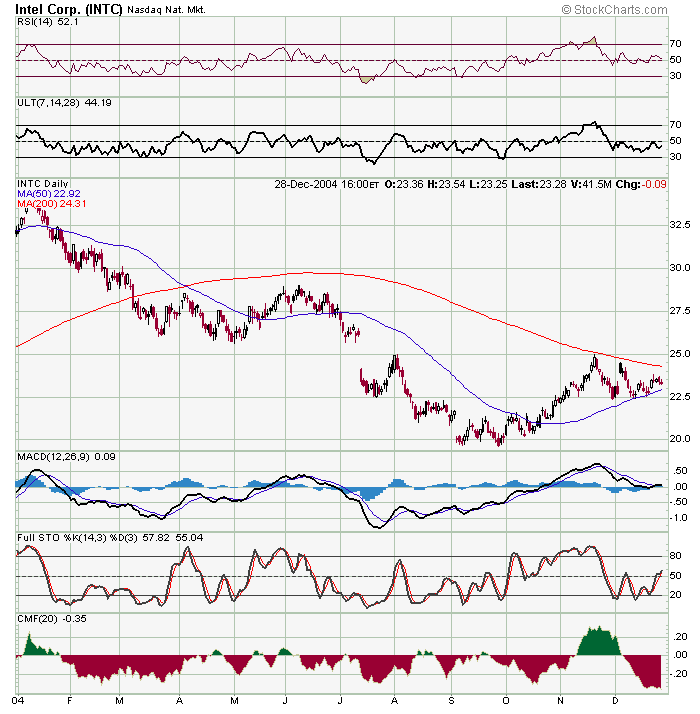
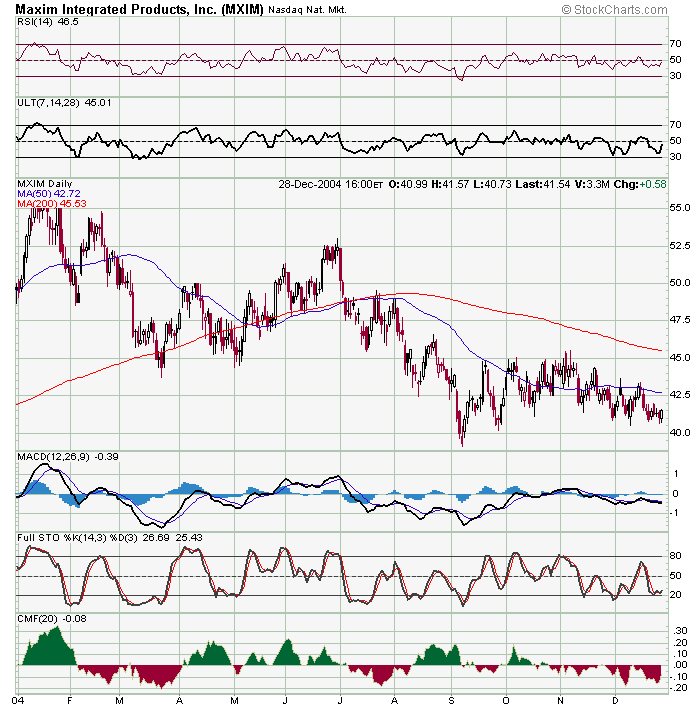
The three daily year-to-date charts show the SOX (Semiconductor Index) continues to trade between its 50 and 200 day MAs. Also, INTC is trading between those MAs and MXIM is below those MAs. The difference between the SOX's 50 and 200 day MAs is narrowing. So, there may be a big move to upside or downside soon.
Given the semis underperformed this year. There may be little buying before end-of-the year window dressing. However, there has been enough support for the SOX to hold its 50 day MA. So, perhaps, the SOX will breakout to the upside sometime in Jan.
 |
|
| Back to top |
|
 |
|
|
You cannot post new topics in this forum
You cannot reply to topics in this forum
You cannot edit your posts in this forum
You cannot delete your posts in this forum
You cannot vote in polls in this forum
|
|
 FAQ
FAQ Search
 Memberlist
 Usergroups
 Register
 Profile
 Log in to check your private messages
 Log in
