 |
PeakTrader.com
Economics, Portfolio Optimization, and Technical Analysis
|
| View previous topic :: View next topic |
| Author |
Message |
arthur
Guest
|
 Posted: Mon Dec 27, 2004 5:15 pm Post subject: AMGN and BTK charts Posted: Mon Dec 27, 2004 5:15 pm Post subject: AMGN and BTK charts |
 |
|
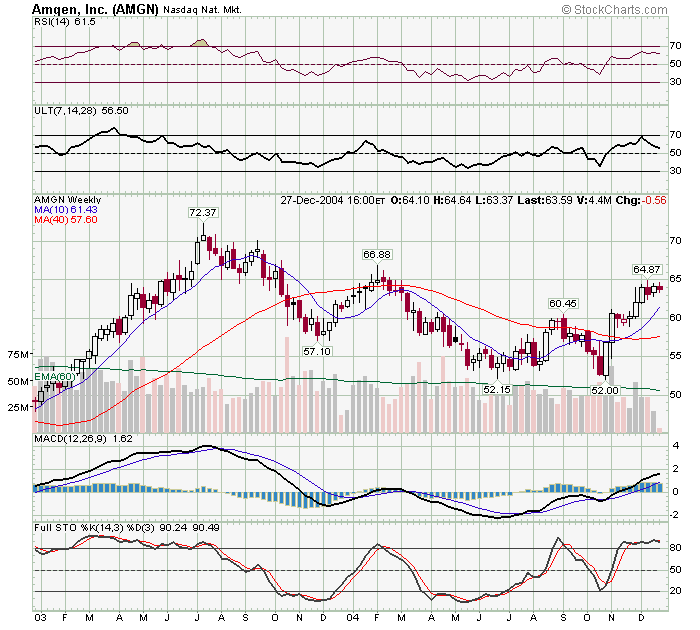
The AMGN weekly chart shows a steady trading range for several weeks. Also, AMGN is above it's 10 and 40 week MAs, and the 10 week MA may be significant support. Consequently, AMGN may be a safer trade than SMH.
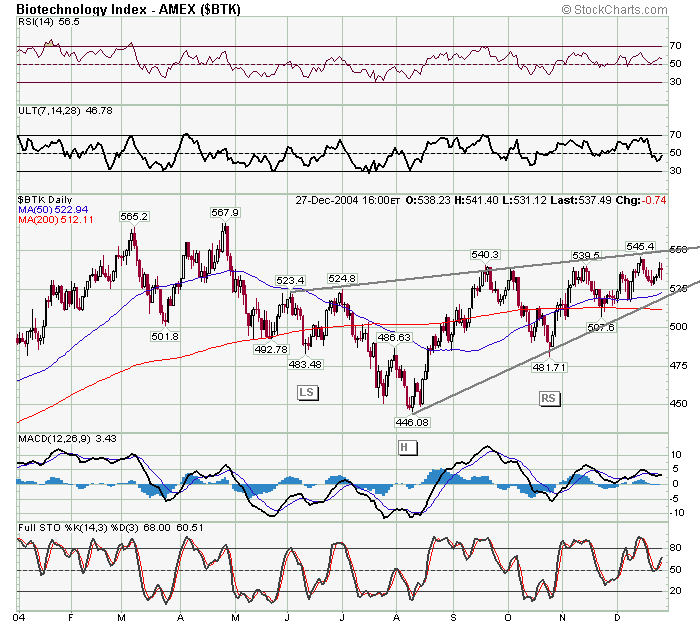
The second chart is a BTK year-to-date daily chart (AMGN is the largest component). BTK created a bullish inverse head & shoulders pattern. The uptrend line, and 50 & 200 day MAs may together provide strong support. Consequently, BTK may breakout to the upside.
 |
|
| Back to top |
|
 |
|
|
You cannot post new topics in this forum
You cannot reply to topics in this forum
You cannot edit your posts in this forum
You cannot delete your posts in this forum
You cannot vote in polls in this forum
|
|
 FAQ
FAQ Search
 Memberlist
 Usergroups
 Register
 Profile
 Log in to check your private messages
 Log in
