 |
PeakTrader.com
Economics, Portfolio Optimization, and Technical Analysis
|
| View previous topic :: View next topic |
| Author |
Message |
arthur
Guest
|
 Posted: Fri Dec 17, 2004 8:29 pm Post subject: SMH Chart Posted: Fri Dec 17, 2004 8:29 pm Post subject: SMH Chart |
 |
|
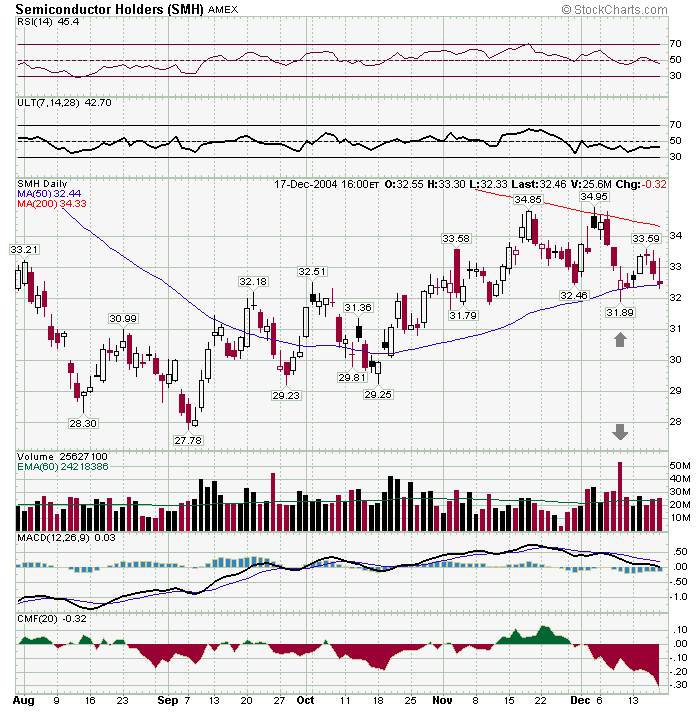
When SMH fell below its 50 day MA recently, there was strong buying support (see arrows). SMH fell on Fri after the Nov Semi book-to-bill ratio came in at 1.00 (and came in at 0.94 in Sep and 0.96 in Oct, reported in Oct and Nov). However, SMH closed above its 50 day MA, on only slightly higher volume than the day before, while the market fell sharply intraday. The 50 day MA hit bottom at just over 30 and has been rising. However, there's resistance at the 200 day MA. It seems, SMH will trade between the 50 and 200 day MAs and then make a big move one way or the other, perhaps on the Dec book-to-bill ratio, that will be reported in mid-Jan, or on durable goods orders for semi-related products.
 |
|
| Back to top |
|
 |
|
|
You cannot post new topics in this forum
You cannot reply to topics in this forum
You cannot edit your posts in this forum
You cannot delete your posts in this forum
You cannot vote in polls in this forum
|
|
 FAQ
FAQ Search
 Memberlist
 Usergroups
 Register
 Profile
 Log in to check your private messages
 Log in
