arthur
Guest
|
 Posted: Sat Dec 04, 2004 4:15 pm Post subject: SPX Trading Chart Posted: Sat Dec 04, 2004 4:15 pm Post subject: SPX Trading Chart |
 |
|
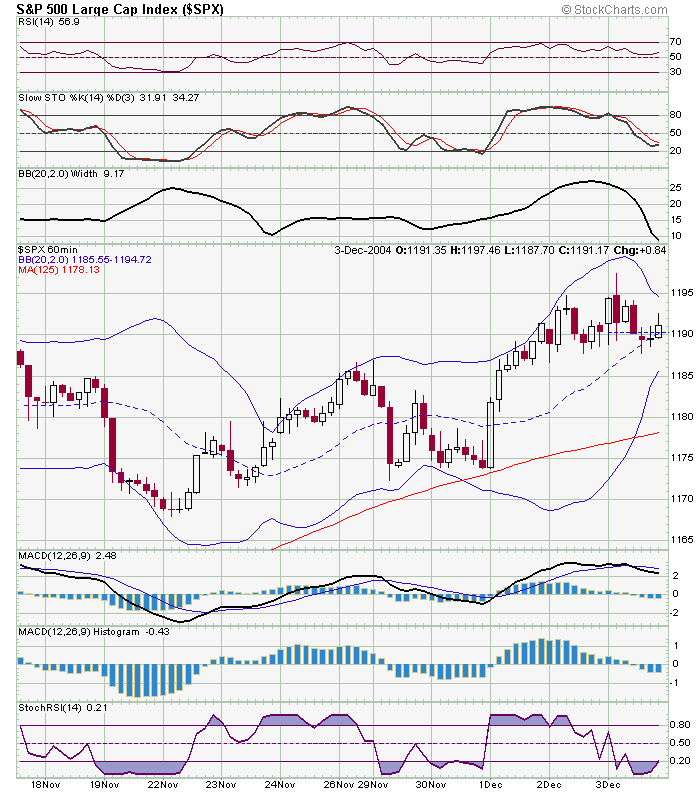
There may be an excellent opportunity to trade SPX Dec puts Mon. If SPX opens high Mon morning, e.g. 1,195, then it may pullback similar to Fri morning. However, SPX has opened lower on most days recently. The narrowing of Bollinger Bands normally precede a big move. Given the weak economic data and huge bond market sell-off Fri, the move may be to the downside. Morevoer, oil prices fell sharply late last week, and may be short-term oversold. The MACD (bearish crossover) and MACD Histogram are currently bearish, short-term, although the Slow Stochastic and Stochastic RSI may be turning bullish. However, if SPX fails to hold 1,186, then 1,173 is next major support. I believe, SPX will either trade within 1,186 and 1,198 (Fri's high) or test the low 1,170s. I don't expect a breakout above 1,198 next week, unless there is unexpected positive news, including a further fall in oil prices. Consequently, SPX Dec puts may be bought on bounces and if SPX falls to the low 1,170s, then SPX Dec calls may be bought (also OEX Dec options may be traded).
 |
|

 FAQ
FAQ Search
 Memberlist
 Usergroups
 Register
 Profile
 Log in to check your private messages
 Log in

