arthur
Guest
|
 Posted: Thu Nov 11, 2004 7:18 pm Post subject: SPX charts Posted: Thu Nov 11, 2004 7:18 pm Post subject: SPX charts |
 |
|
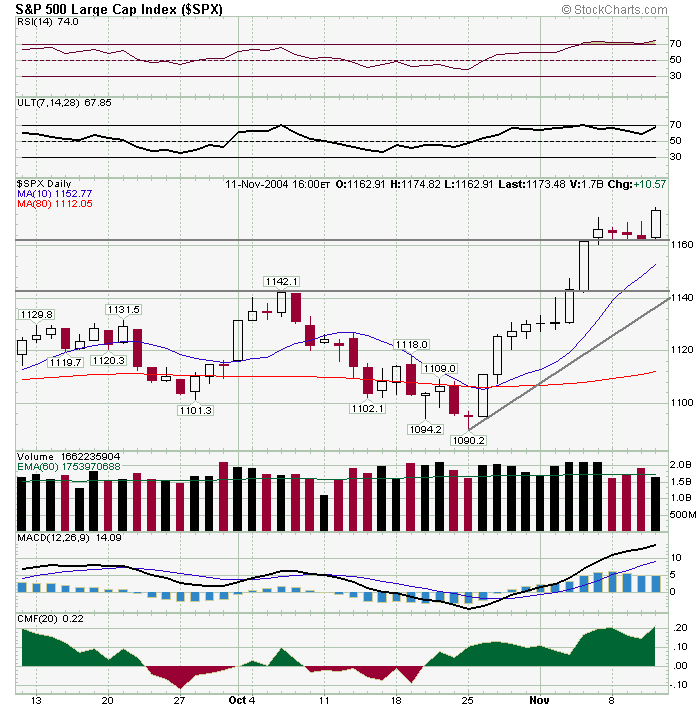
The SPX daily chart shows support at 1,162 (three-day consolidation), 1,152 (50 day MA), and 1,142 (previous high). SPX rallied on lower volume today. The SPX monthly chart shows strong resistance at 1,160 (50% Fibonacci level), 1,162 (80 month MA), the Price-by-Volume zone (circle), and 1,177 (a previous multi-year high). So, there is strong resistance at 1,160 to 1,180 and it may take several attempts for SPX to break above the resistance zone. Consequently, I expect a pullback soon. I believe, the most bullish scenerio is SPX consolidating at 1,162 to 1,180 and then breaking-out to new highs. More bearish scenerios are SPX falling to lower short-term support levels and creating a new trading range e.g. 1,142 to 1,180. I believe, options expiration week, next week, will lead SPX to a more volatile range.
 |
|

 FAQ
FAQ Search
 Memberlist
 Usergroups
 Register
 Profile
 Log in to check your private messages
 Log in

