arthur
Guest
|
 Posted: Tue Nov 09, 2004 8:29 pm Post subject: SPX chart Posted: Tue Nov 09, 2004 8:29 pm Post subject: SPX chart |
 |
|
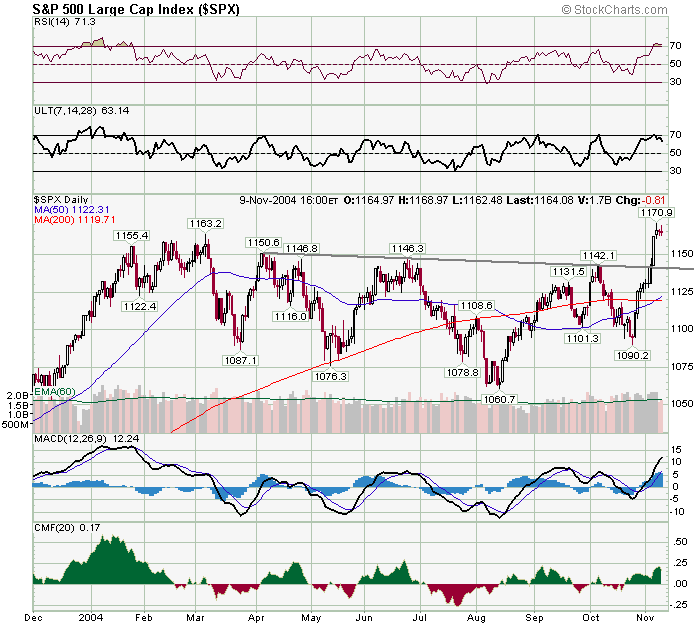
Normally, an almost vertical rise is unsustainable and followed by a pullback. SPX major (multi-year) resistance is at 1,175 to 1,180. RSI is overbought and the oscillator (ULT) is pointing down. Major support is at the previous highs (1,142 to 1,163) and the neckline of the inverse head & shoulders. I tend to believe, SPX hit a short-term top Fri at 1,170 and will pullback to 1,142 to 1,150 before making a new high (e.g. 1,180). However, it's possible, SPX will rally to 1,175 to 1,180 first and then pullback, e.g. to 1,150. If SPX pulls-back 16 points, then OEX will pullback roughly eight points. It may be best to buy OEX Nov puts on bounces, and sell on dips, this week and SPX Nov puts (or calls) next week (options expiration week) to take advantage of time decay for greater leverage (strike prices, i.e. in-the-money options, become more important closer to expiration).
 |
|

 FAQ
FAQ Search
 Memberlist
 Usergroups
 Register
 Profile
 Log in to check your private messages
 Log in

