PeakTrader.com Forum Index PeakTrader.com
Economics, Portfolio Optimization, and Technical Analysis
 
 FAQFAQ   SearchSearch   MemberlistMemberlist   UsergroupsUsergroups   RegisterRegister 
 ProfileProfile   Log in to check your private messagesLog in to check your private messages   Log inLog in 
Log inFast Charts

Updated EBAY Chart & Commentary

 
Post new topic   Reply to topic     PeakTrader.com Forum Index -> Top Stock Picks
View previous topic :: View next topic  
Author Message
administrator
Site Admin


Joined: 28 Dec 2005
Posts: 12643

PostPosted: Sun Aug 13, 2006 7:28 am    Post subject: Updated EBAY Chart & Commentary Reply with quote

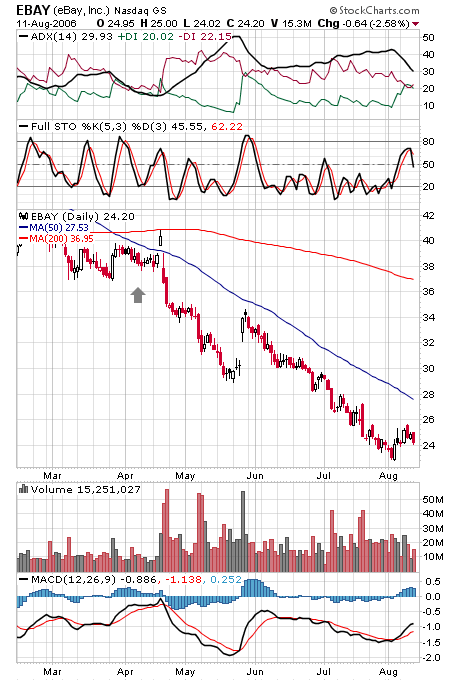
The EBAY six-month daily chart shows a bearish engulfing Fri. However, a bearish engulfing was created several months ago (see arrow) that lead to limited short-term downside. After the steep and sustained decline, there may be selling into strength, unless there's a catalyst for the shares to rise and stay elevated. Consequently, a volatile consolidation may soon take place, e.g. between 23 and 27. However, EBAY typically outperforms the market in the second half of the year.

Back to top
View user's profile Send private message
Display posts from previous:   
Post new topic   Reply to topic     PeakTrader.com Forum Index -> Top Stock Picks All times are GMT - 8 Hours
Page 1 of 1

 
Jump to:  
You cannot post new topics in this forum
You cannot reply to topics in this forum
You cannot edit your posts in this forum
You cannot delete your posts in this forum
You cannot vote in polls in this forum


Powered by PeakTrader 2.0.8 © 2001, 2002