administrator
Site Admin
Joined: 28 Dec 2005
Posts: 12643
|
 Posted: Fri Jul 21, 2006 3:06 pm Post subject: EBAY Chart & Commentary Posted: Fri Jul 21, 2006 3:06 pm Post subject: EBAY Chart & Commentary |
 |
|
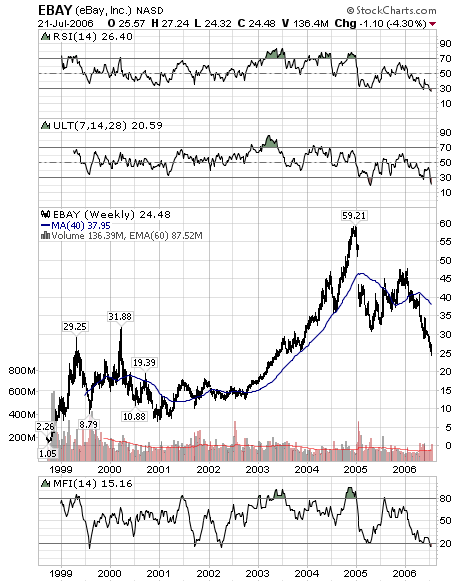
The eight-year weekly chart shows EBAY is severely oversold. RSI and ULT have never been below 30 at the same time before, and both are currently well below 30. Also, MFI (Money Flow Index) is well below 20. Moreover, EBAY is at the bottom of the 2003 consolidation area where it generally traded between 24 and 30 for six months. Consequently, a trading range is likely to take place over the next few weeks, e.g. between 24 and 27.
Some current EBAY call option prices are Aug 22.5 2.40; Aug 25 0.95; Aug 27.5 0.30; and Aug 30 0.10. If EBAY rises 1 1/4 points next week, the Aug 27.5 and Aug 30 calls may double. On Mon, Sep options may be available, and perhaps Sep 27.5 or 30 calls will be better buys. So, there may be many opportunities to make big gains with EBAY calls.
 |
|

 FAQ
FAQ Search
 Memberlist
 Usergroups
 Register
 Profile
 Log in to check your private messages
 Log in


