administrator
Site Admin
Joined: 28 Dec 2005
Posts: 12643
|
 Posted: Thu Jun 29, 2006 5:01 pm Post subject: SPY Trading Range Posted: Thu Jun 29, 2006 5:01 pm Post subject: SPY Trading Range |
 |
|
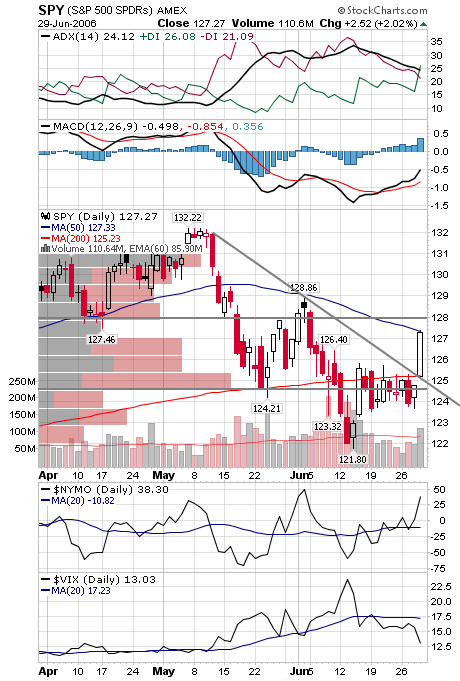
The SPY daily chart shows a breakout above the downtrend line and a close at the 50-day MA. SPY rose 2 1/2 points on Thu and traded almost entirely between the 200 and 50-day MAs. The ADX line above the chart had a bullish crossover (when the green line rose above the red line). Fri is the end of the quarter. So, it's possible SPY will rise to next resistance at 128 (i.e. Apr low area and May top) with upper resistance above 128 3/4 (i.e. early-Jun high). However, over the next week, SPY may consolidate in the May and Jun congestion area with support at 124.60 (or SPX 1,246 major level) and resistance at 128. The daily NYMO, below price chart, is relatively overbought and the NYMO 20-day MA hasn't reached negative 30, which it may in Aug. Also, the daily VIX is far below the VIX 20-day MA, which is short-term bearish (i.e. next week). An SPY stop at 129 with a potential target below 125 short-term and below 120 intermediate-term. SPY may be in a slight uptrend over the next two weeks and trade mostly between 125 and 127.
 |
|

 FAQ
FAQ Search
 Memberlist
 Usergroups
 Register
 Profile
 Log in to check your private messages
 Log in


