administrator
Site Admin
Joined: 28 Dec 2005
Posts: 12643
|
 Posted: Sun May 07, 2006 9:29 am Post subject: Comparison Charts Posted: Sun May 07, 2006 9:29 am Post subject: Comparison Charts |
 |
|
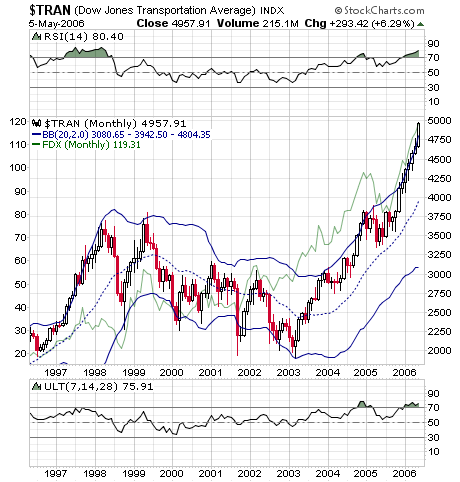
Below is a 10-year monthly chart of the Transport Index (candlesticks and right scale) and FDX (green line and left scale). FDX is one of the 20 components of the Transport Index. The Transport Index has risen on strong import growth, which needs shipping. Also, railroads outperformed, because of relatively higher oil prices.
Both the Transports and FDX closed at all-time highs Fri. It's rare when the Transports monthly RSI and ULT both reach over 70 (see above and below price chart). Consequently, both the Transports and FDX may pullback sharply within a few months. FDX puts are not expensive. FDX closed above 119 1/4. The Oct 130 puts may be bought at 12, the Jul 130 puts at 11, and the Jun 125 puts at 6.40 or lower. FDX may pullback over 15 points to below 105.
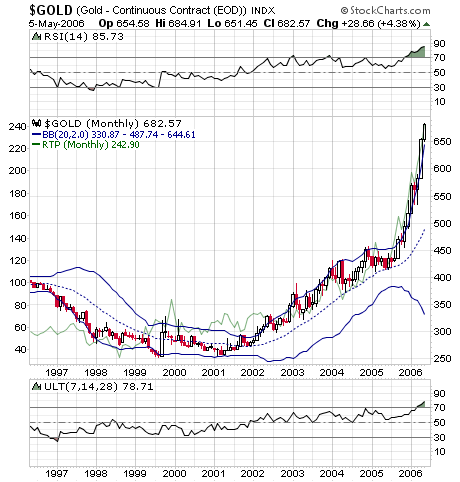
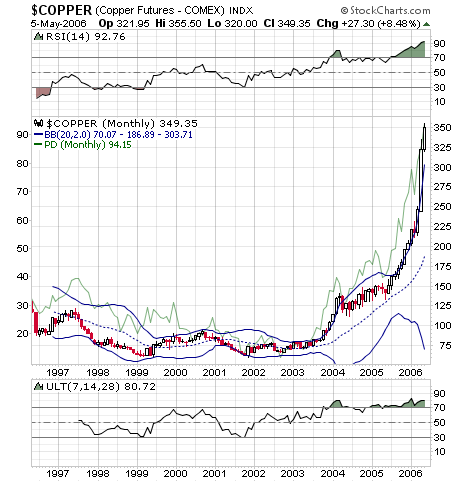
Also, below are similar 10-year monthly comparison charts of the Price of Gold and RTP, and Price of Copper and PD. Gold has risen, in part, on the weakening dollar and higher inflation expectations, including the belief that government inflation data understate true inflation. Copper has risen on above trend global growth (strong demand) and supply constraints.
 |
|

 FAQ
FAQ Search
 Memberlist
 Usergroups
 Register
 Profile
 Log in to check your private messages
 Log in


