administrator
Site Admin
Joined: 28 Dec 2005
Posts: 12643
|
 Posted: Sat Feb 25, 2006 9:48 pm Post subject: OEX Chart & Commentary Posted: Sat Feb 25, 2006 9:48 pm Post subject: OEX Chart & Commentary |
 |
|
The first few days of Mar typically has an upward bias. Consequently, I've been looking for a short-term trade for calls, to partially offset the SPY and IWM puts. OEX has underperformed SPY and IWM for at least two years. The OEX post-bubble lows were 385 in Jul '02 and 388 in Oct '02.
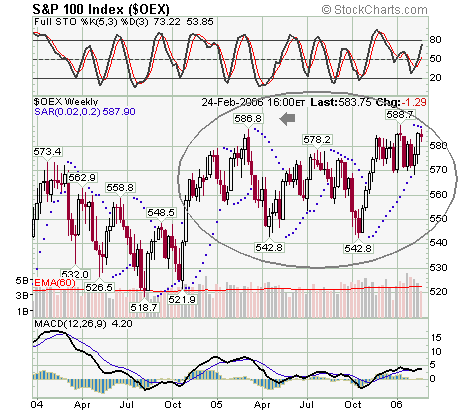
The chart below is an OEX weekly chart, since late Dec '03 (reproduced at top of page five in Chart Room). The 2005 high at 586.8 was reached in the first week of Mar (see arrow). The trading range last week was slightly above 582 to slightly above 586 3/4. Also, the Jan high was 588.7. The weekly Parabolic SAR (blue dots) closed at 587.9, and should fall slightly next week, perhaps to 587. OEX may trade between 582 and 587 next week. So, there may be an opportunity to make a gain, e.g. with Mar 580 calls, although it's a high risk trade. It may be best just to continue holding SPY and IWM puts.
 |
|

 FAQ
FAQ Search
 Memberlist
 Usergroups
 Register
 Profile
 Log in to check your private messages
 Log in


