administrator
Site Admin
Joined: 28 Dec 2005
Posts: 12643
|
 Posted: Sat Feb 04, 2006 9:02 am Post subject: OEX & IWM Charts with Commentary Posted: Sat Feb 04, 2006 9:02 am Post subject: OEX & IWM Charts with Commentary |
 |
|
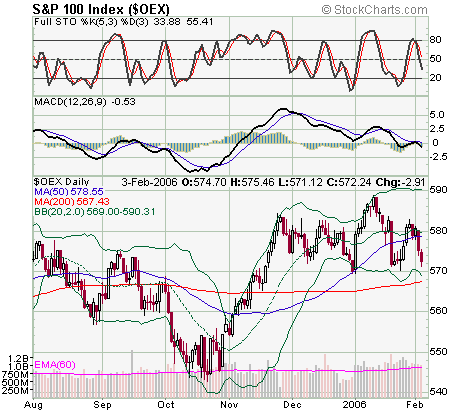
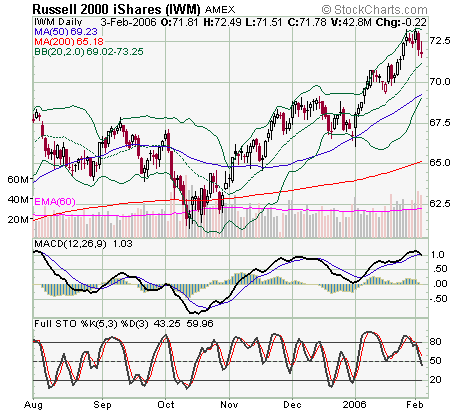
OEX and IWM generally move together. However, OEX is relatively undervalued compared to IWM. OEX is in the lower half of the Bollinger Band, and between the 50 and 200 day MAs, while IWM is in the upper half of the Bollinger Band, above the 50-day MA, and well above the 200-day MA. On Dec 31st, OEX was at 569, while IWM was at 66. However, just over a month later, OEX is at 572 1/4, while IWM is at 71 3/4. The OEX MACD has been bearish, while the IWM MACD just turned bearish. Consequently, OEX calls may be an excellent hedge for IWM puts, since there may be little downside for OEX and much more upside. Perhaps, OEX Feb 570 or Mar calls and IWM Feb 74 or Mar puts are buys on Monday, taking advantage of volatility (Feb options expire in two weeks).
 |
|

 FAQ
FAQ Search
 Memberlist
 Usergroups
 Register
 Profile
 Log in to check your private messages
 Log in


