 |
PeakTrader.com
Economics, Portfolio Optimization, and Technical Analysis
|
| View previous topic :: View next topic |
| Author |
Message |
arthur
Guest
|
 Posted: Wed Dec 21, 2005 5:30 pm Post subject: GM Chart Posted: Wed Dec 21, 2005 5:30 pm Post subject: GM Chart |
 |
|
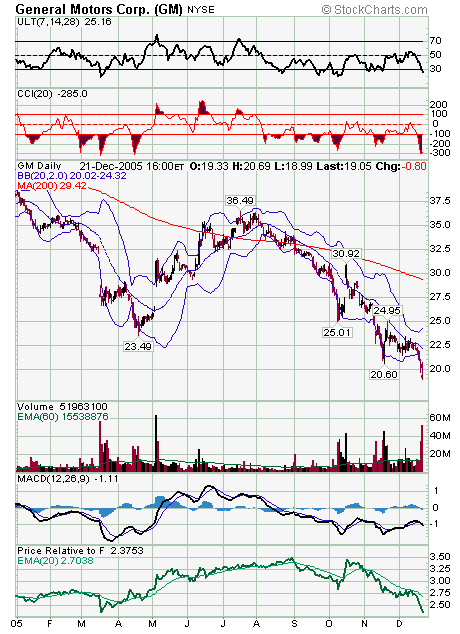
GM traded 52 million shares today, which is about 10% of its shares outstanding. Yesterday, it traded over 34 million shares. Perhaps, just about everyone who wanted to sell, short-term, has sold. GM showed support at 19, and its market cap fell below $10.8 billion. The year-to-date chart shows an off-and-on capitulation over the past three months. GM may be sold enough short-term to bounce just from selling exhausion, accelerated by end-of-the-year window dressing. Moreover, any positive news should send the stock way up. The chart also shows GM is relatively undervalued compared to F (Ford), although F fell from 14 in January to 8. The last time GM was this relatively undervalued, it began a volatile rally.
 |
|
| Back to top |
|
 |
|
|
You cannot post new topics in this forum
You cannot reply to topics in this forum
You cannot edit your posts in this forum
You cannot delete your posts in this forum
You cannot vote in polls in this forum
|
|
 FAQ
FAQ Search
 Memberlist
 Usergroups
 Register
 Profile
 Log in to check your private messages
 Log in
