 |
PeakTrader.com
Economics, Portfolio Optimization, and Technical Analysis
|
| View previous topic :: View next topic |
| Author |
Message |
arthur
Guest
|
 Posted: Sat Dec 17, 2005 3:18 pm Post subject: TLT Chart Posted: Sat Dec 17, 2005 3:18 pm Post subject: TLT Chart |
 |
|
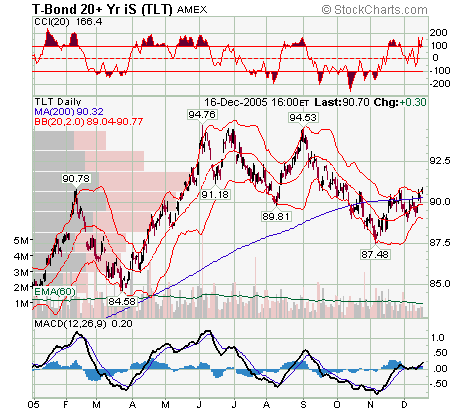
There's almost a perfectly negative correlation between TLT and the 30-year bond yield. Over the past two years, the 30-year yield has been bottoming at 4.2% to 5.5%, after being in a downtrend for over 20 years. On Friday, the 30-year yield closed at 4.65%, which is in the lower half of the range. For each 0.10% move in the yield, TLT moves roughly one-point. So, if the current yield rises from 4.65% to 4.75%, TLT will fall from 90.70 to 89.70. The long-bond yield may rise, perhaps sharply, over the next few years, causing a downtrend in TLT (which I may explain in an article soon).
 |
|
| Back to top |
|
 |
|
|
You cannot post new topics in this forum
You cannot reply to topics in this forum
You cannot edit your posts in this forum
You cannot delete your posts in this forum
You cannot vote in polls in this forum
|
|
 FAQ
FAQ Search
 Memberlist
 Usergroups
 Register
 Profile
 Log in to check your private messages
 Log in
